Table of Contents
OFFERING CIRCULAR, DATED MARCH 13, 2018
INSTITUTE FOR WEALTH HOLDINGS, INC.
Maximum offering of $20,000,000
Up to 2,000,000 shares of Series D Convertible Preferred Stock
And up to 2,000,000 shares of Common Stock into which the Series D Convertible Preferred Stock May Convert
Two Galleria Tower
13455 Noel Road, Suite 100
Dallas, Texas 75240
(972) 450-6000
www.iwhinc.com
The Institute for Wealth Holdings, Inc., a Delaware corporation, (the “Company,” “we” or “our”) is offering a maximum of 2,000,000 shares of Series D Convertible Preferred Stock, par value $0.001. The Series D Convertible Preferred Stock may be converted into shares of Common Stock of the Company at the discretion of the investor. As a result, the Company is qualifying up to 2,000,000 shares of Series D Convertible Preferred Stock and up to 2,000,000 shares of Common Stock under this offering statement, of which this offering circular is a part. See “Description of Capital - Offered Securities” on Page 56 for additional information.
This best efforts offering does not have a minimum number of securities which must be sold. Since there is no minimum amount of securities that must be purchased in this offering, all accepted and approved subscription proceeds will be available to us after release from escrow and no investor funds will be reimbursed if the proceeds of this offering are insufficient to cover the costs of the offering. The offering will continue until the earlier of twelve (12) months from the date of this offering is qualified for sale or the date when all offered securities have been sold.
| Price to Public | Discounts or Commissions |
Proceeds to Issuer per share* |
Proceeds to other persons |
|||||||||||||
| Per Share |
$ | 10.00 | 7% or $0.70 | ^ | $ | 9.30 | $ | 0 | ||||||||
| Maximum offering amount |
$ | 20,000,000 | $ | 1,400,000 | $ | 18,600,000 | $ | 0 | ||||||||
| * | For anticipated expenses, See “Use of Proceeds.” This does not include legal or accounting expenses. |
| ^ | This is a 7% commission to our placement agent, Lanier Securities, LLC. Please refer to “Plan of Distribution” on Page 18 for a description of the compensation arrangements with Lanier Securities, LLC in connection with this offering. |
Prior to this offering, there has been no trading market for our shares.
These are speculative securities. Investing in our shares involves significant risks. You should purchase these securities only if you can afford a complete loss of your investment. See “Risk Factors” beginning on Page 9.
Generally, no sale may be made to you in this offering if the aggregate purchase price you pay is more than 10% of the greater of your annual income or net worth. Different rules apply to accredited investors and non-natural persons. Before making any representation that your investment does not exceed applicable thresholds, we encourage you to review Rule 251(d)(2)(i)(C) of Regulation A. For general information on investing, we encourage you to refer to www.investor.gov.
Table of Contents
THE UNITED STATES SECURITIES AND EXCHANGE COMMISSION DOES NOT PASS UPON THE MERITS OF OR GIVE ITS APPROVAL TO ANY SECURITIES OFFERED OR THE TERMS OF THE OFFERING, NOR DOES IT PASS UPON THE ACCURACY OR COMPLETENESS OF ANY OFFERING CIRCULAR OR OTHER SOLICITATION MATERIALS. THESE SECURITIES ARE OFFERED PURSUANT TO AN EXEMPTION FROM REGISTRATION WITH THE COMMISSION; HOWEVER, THE COMMISSION HAS NOT MADE AN INDEPENDENT DETERMINATION THAT THE SECURITIES OFFERED ARE EXEMPT FROM REGISTRATION.
AN OFFERING STATEMENT PURSUANT TO REGULATION A RELATING TO THESE SECURITIES HAS BEEN FILED WITH THE SECURITIES AND EXCHANGE COMMISSION. INFORMATION CONTAINED IN THIS PRELIMINARY OFFERING CIRCULAR IS SUBJECT TO COMPLETION OR AMENDMENT. THESE SECURITIES MAY NOT BE SOLD NOR MAY OFFERS TO BUY BE ACCEPTED BEFORE THE OFFERING STATEMENT FILED WITH THE COMMISSION IS QUALIFIED. THIS PRELIMINARY OFFERING CIRCULAR SHALL NOT CONSTITUTE AN OFFER TO SELL OR THE SOLICITATION OF AN OFFER TO BUY NOR MAY THERE BE ANY SALES OF THESE SECURITIES IN ANY STATE IN WHICH SUCH OFFER, SOLICITATION OR SALE WOULD BE UNLAWFUL BEFORE REGISTRATION OR QUALIFICATION UNDER THE LAWS OF SUCH STATE. WE MAY ELECT TO SATISFY OUR OBLIGATION TO DELIVER A FINAL OFFERING CIRCULAR BY SENDING YOU A NOTICE WITHIN TWO BUSINESS DAYS AFTER THE COMPLETION OF OUR SALE TO YOU THAT CONTAINS THE URL WHERE THE FINAL OFFERING CIRCULAR OR THE OFFERING STATEMENT IN WHICH SUCH FINAL OFFERING CIRCULAR WAS FILED MAY BE OBTAINED.
This offering circular is following the offering circular format described in Part II (a)(1)(ii) of Form 1-A.
2
Table of Contents
| 4 | ||||
| 9 | ||||
| 17 | ||||
| 18 | ||||
| 19 | ||||
| 21 | ||||
| 39 | ||||
| MANAGEMENT AND FINANCIAL CONDITION AND RESULTS OF OPERATIONS |
40 | |||
| 47 | ||||
| 52 | ||||
| SECURITY OWNERSHIP OF MANAGEMENT AND CERTAIN SECURITYHOLDERS |
54 | |||
| 55 | ||||
| 56 | ||||
| 59 | ||||
No dealer, salesperson or other person is authorized to give any information or to represent anything not contained in this offering circular. You must not rely on any unauthorized information or representations. This offering circular is an offer to sell only the shares offered hereby, but only under circumstances and in jurisdictions where it is lawful to do so. The information contained in this offering circular is current only as of its date.
3
Table of Contents
The following summary highlights selected information contained in this offering circular. This summary does not contain all the information that may be important to your investment in the offered securities. You should read this entire offering circular carefully, including the “Risk Factors” section, our audited, consolidated financial statements and the related notes included elsewhere in this offering circular, before making an investment decision. Unless the context otherwise requires, the terms “Institute for Wealth,” “IWH,” “the Company,” “we,” “us” and “our” in this offering circular refers to Institute for Wealth Holdings, Inc., a Delaware corporation.
Our Company
Background
Our company is the result of a successful business combination in 2016 of two companies, the Institute for Wealth Management, LLC, a Delaware limited liability company (“IWM”), which was founded by Matthew D. Medeiros in 2003, and Institute for Wealth Holdings, Inc., formerly Cherry, Inc., which was founded in 2008 by Dewey M. “Rusty” Moore, Jr. Both of our founders are experienced investment professionals who have demonstrated proven leadership skills and excellence in the development of innovative products and services, and superior team building capabilities in launching successful companies.
All of our operations are conducted by our four subsidiaries, IWM, Institute for Wealth Advisors, Inc., a Delaware corporation (“IWA”), Institute for Wealth Consultants, Inc., a Delaware corporation (“IWC”), and Institute for Wealth Partners, Inc., a Delaware corporation (“IWP”). IWM, IWA and IWC operate a dual investment advisory and investment management platform for our investment advisory representatives (“IARs”) and clients through our various subsidiaries. We provide high quality investment management and advice to clients by enrolling, supporting and supervising qualified investment advisors. Our mission statement clearly articulates our business model: Empowering Trusted Advisors to succeed financially by providing quality and value in wealth management, financial planning, financial tools and investment advisory services based on proven principles and the highest standards of trust. We operate under this combined platform by utilizing our proven management team to recruit and train associate investment advisers and IARs to gather AUM under a successful, client-centric national brand. We provide, through multiple custodians, a single client interface for the administration, execution and reporting for client accounts, and offer advisers online access to fee tracking and payments. This approach allows for higher productivity by granting our advisors and IARs time to focus on existing clients and prospective new clients.
We believe ours is the “Ideal Business Model,” one that derives recurring income from an asset-based revenue model. We function much like a bank, in that client assets are deposited at one or more of our custodians through which we provide our client services for a fee. Our subsidiaries operate investment management, wealth management and investment advisory platforms, which derive fee based compensation based on the amount of assets under management (“AUM”). This is the fiduciary, or investment advisor, model where an increase in total assets is in the client’s and advisor’s best interests, a “win-win” relationship. Our company enjoys an excellent business reputation. Since their inception, neither IWM, IWA nor their affiliates have had an unresolved customer complaint.
Our subsidiaries provide our investment advisory, wealth management and portfolio managements services, client services and multiple custodial relationships through our subsidiary, IWM founded in 2003, which is headquartered in Denver, Colorado. (See “Description of Business” on Page 21). In addition, we provide investment advisory support services to our IARs through another subsidiary, IWA,
4
Table of Contents
headquartered in Dallas, Texas. The Institute for Life & Annuity, Inc., a Texas corporation (“ILA”), our affiliated corporate life insurance agency, complements our IARs’ risk management services to clients. We also have recently added IWC, which provides IAR support services, and access to life insurance and annuity products and comprehensive fee-based financial planning at ILA. (See “Structure of Institute of Wealth Holdings” on Page 25).
The combined Institute for Wealth family of companies offers a robust platform to support our IARs and capture client AUM. We are growing rapidly, with over $890.1 million AUM through approximately forty IARs. Since December 31, 2015, on a pro forma basis, our total revenue has grown at a compound annual growth rate (“CAGR”) of 91% and AUM has grown at a CAGR of 104%. We expect to grow the number of IARs to over 100 and for AUM to grow to over $5 billion in the next 3 to 5 years if we successfully implement our growth strategy. The capital raised in this offering is expected to facilitate and enhance our growth strategy.
Executive Committee
The Company is led by a veteran leadership team with extensive business and investment management experience. D. M. “Rusty” Moore and Matthew D. Medeiros are our principal executives. Mr. Moore has worked as an executive in the financial management sector since the early 1990s and led Rushmore Financial Group, Inc., through its initial public offering in 1998, and over the following fifteen years as CEO he led his company through a number of public and private offerings, merger and acquisition transactions. Mr. Medeiros has significant investment management experience in the United States and abroad, and has been frequently cited and interviewed by media outlets, universities and professional organizations with respect to this experience. For more information about Mr. Moore, Mr. Medeiros and other vital members of our management team. (See “Directors, Officers and Significant Employees” on Page 47).
The Offering
Overview
We are offering 2,000,000 shares of Series D Convertible Preferred Stock, par value of $0.001 for $10.00 a share. The Series D Convertible Preferred Stock may be converted into shares of our Common Stock at the discretion of each investor. As such, we are qualifying up to 2,000,000 shares of Series D Convertible Preferred Stock and up to 2,000,000 shares of Common Stock under this offering statement, of which this offering circular is a part.
The Series D Convertible Preferred Stock: (i) is entitled to 7% annual dividends, payable quarterly in cash as declared by the Board of Directors; (ii) is convertible into shares of our common stock at the option of the stockholder for $10.00 per share; (iii) ranks pari-pasu with other preferred stock with respect to liquidation, but maintains a liquidation preference equal to 1.65 times the price of the offered securities; and (iv) is entitled to vote on an as-converted basis with common stock on any matter presented to the stockholders and separately as a class for matters relating to the offered securities. (See “Description of Capital – Offered Securities” for a description of the Series D Convertible Preferred Stock and the Common Stock on Page 56) .
There can be no assurance that all or any of the offered securities will be sold. To facilitate the offering, we have engaged Lanier Securities, LLC (“Lanier”) to act as our placement agent for the sale of the offered securities.
5
Table of Contents
Opportunities
IWH’s current business structure was created in September 2016 when we, as Cherry, Inc., merged with IWM’s parent company. As a result of this merger, we now appeal to a broader base of successful “break-away” brokers and independent investment advisors and provide expansive investment management and financial planning strategies nationwide. We anticipate that due to market conditions and recent consolidation trends there are significant opportunities to acquire smaller registered investment advisers (“RIAs”) and independent IARs who cannot afford the increased complexity and compliance costs associated with the investment management industry. We are now seeking approximately $20,000,000 to facilitate growth through the acquisition of additional IARs and RIAs, improve our technological infrastructure, reduce our outstanding debt, simplify our capital structure through the redemption or exchange of shares of our outstanding Series B Convertible Preferred stock, and to reserve a portion of the proceeds for the payment of quarterly dividends on the Series D Convertible Preferred Stock and accumulated but unpaid dividends on our Series B Convertible Preferred Stock.
We operate an investment management and investment advisory platform, which receives fee based compensation for our portfolio management services based on the total AUM at IWM, IAR support services at IWA and IWC, and life insurance and annuity overrides from ILA. This is the fiduciary, or investment advisor, model where an increase in total assets is in the client’s and advisor’s best interest. We believe that by increasing the number of IARs and RIAs we work with, we can significantly increase our AUM and profitability.
Current Stock
Our authorized capital stock consists of 50,000,000 shares of Common Stock, par value $0.001 and 10,000,000 shares of Preferred Stock, par value of $0.001 (“Preferred Stock”). The Preferred Stock currently consists of 70,000 authorized shares of Series B Convertible Preferred Stock, 1,925,000 authorized shares of Series C Convertible Preferred Stock and 2,500,000 authorized shares of Series D Convertible Preferred Stock. We previously issued a class of Series A preferred stock, which has been redeemed and may not be reissued. As a result, 5,500,000 shares of Preferred Stock remain undesignated.
These undesignated shares of Preferred Stock may be issued from time to time in one or more series pursuant to a resolution or resolutions providing for such issue duly adopted by the Board of Directors. The Board is further authorized, subject to limitations prescribed by law, to fix by resolution or resolutions the designations, powers, preferences and rights, and the qualifications, limitations or restrictions thereof, of any wholly unissued series of Preferred Stock, including without limitation authority to fix by resolution or resolutions the dividend rights, dividend rate, conversion rights, voting rights, rights and terms of redemption (including sinking fund provisions), redemption price or prices, and liquidation preferences of any such series, and the number of shares constituting any such series and the designation thereof, or any of the foregoing.
6
Table of Contents
Prior to this offering, our current capitalization consists of the following classes of securities:
| Class of Stock |
Authorized Shares | Outstanding | ||||||
| Common Stock |
50,000,000 | 2,700,710 | ||||||
| Preferred Stock |
10,000,000 | 1,963,584 | ||||||
| 1. Series B Convertible Preferred Stock |
70,000 | 42,750 | ||||||
| 2. Series C Convertible Preferred Stock |
1,925,000 | 1,904,404 | ||||||
| 3. Series D Convertible Preferred Stock |
2,500,000 | 267,300 | ||||||
7
Table of Contents
CAUTIONARY NOTE REGARDING FORWARD-LOOKING STATEMENTS
We make forward-looking statements in this offering circular, including, without limitation, in the sections captioned “Summary,” “Risk Factors,” “Description of Business” and various other sections. In some cases, you can identify these statements by forward-looking words such as “may,” “might,” “should,” “expect,” “plan,” “anticipate,” “believe,” “estimate,” “predict,” “potential” or “continue,” and the negative of these terms and other comparable terminology. These forward-looking statements, which are subject to known and unknown risks, uncertainties and assumptions about us, may include projections of our future financial performance based on our growth strategies and anticipated trends in our business. These statements are only predictions based on our current expectations and projections about future events. There are important factors that could cause our actual results, level of activity, performance or achievements to differ materially from the results, level of activity, performance or achievements expressed or implied by the forward-looking statements. In particular, you should consider the numerous risks and uncertainties described under “Risk Factors.”
While we believe we have identified material risks, these risks and uncertainties are not exhaustive. Other sections of this offering circular describe additional factors that could adversely impact our business and financial performance. Moreover, we operate in a very competitive and rapidly changing environment. New risks and uncertainties emerge from time to time, and it is not possible to predict all risks and uncertainties, nor can we assess the impact of all factors on our business or the extent to which any factor, or combination of factors, may cause actual results to differ materially from those contained in any forward-looking statements.
Although we believe the expectations reflected in the forward-looking statements are reasonable, we cannot guarantee future results, level of activity, performance or achievements. Moreover, neither we nor any other person assumes responsibility for the accuracy or completeness of any of these forward-looking statements. You should not rely upon forward-looking statements as predictions of future events. We are under no duty to update any of these forward-looking statements after the date of this offering circular to conform our prior statements to actual results or revised expectations, and we do not intend to do so.
Forward-looking statements include, but are not limited to, statements about:
| • | our business’ strategies and investment policies; |
| • | our business’ financing plans and the availability of capital; |
| • | our ability to attract and retain IARs and RIAs; |
| • | the risks associated with potential acquisitions we might make; |
| • | the recruitment and retention of our officers and independent contractors; |
| • | our expected levels of compensation; |
| • | the effects of competition on our business; and |
| • | the impact of future legislation and regulatory changes on our business. |
We caution you not to place undue reliance on the forward-looking statements, which speak only as of the date of this offering circular.
8
Table of Contents
Investing in the offered securities involves a high degree of risk. You should carefully consider each of the following risks, together with all other information set forth in this offering circular, including the consolidated financial statements and the related notes, before making a decision to buy the offered securities. The risks described below are not the only risks that we face, but the following is a description of what we consider the key challenges and material risks to our business and an investment in our securities. Our company is still subject to the same risks as all other operating companies in the economy.
Inadequacy of Funds
There is no assurance that the proceeds of this offering will capitalize and sustain the Company sufficiently to allow for working and expansion capital, debt repayment, growth acquisition capital, technology development and investment. If only a fraction of this offering is sold, we may have inadequate funds to fully develop our business and may need debt financing or other capital investment to fully implement our business plans.
Dependence On Management
The growth plan proposed by management will be significantly dependent on our management team. Our success will be particularly dependent on Dewey M. “Rusty” Moore, Jr. and Matthew D. Medeiros. The loss of either of these individuals could have a material adverse effect on the Company. We do not currently maintain a “key man” life insurance policy for either Mr. Moore or Mr. Medeiros. See “Directors, Officers and Significant Employees” section.
We have a limited operating history
Since the merger between the Company and the Institute for Wealth Management Holdings, Inc., we have had a limited operating history. There can be no assurance we will ever operate profitably. The likelihood of our success should be considered in the light of the problems, expenses, difficulties, complications and delays usually encountered by companies in their early stages of development. We may not successfully attain the objectives necessary to overcome these risks and uncertainties.
Placement Agent
We have retained Lanier Securities, LLC (“Lanier”), a broker-dealer registered with the Financial Industry Regulatory Authority (FINRA), as placement agent. A portion of the capital contributions from this offering will be paid to Lanier as commission for its services. Lanier has the ability to assemble selling groups to facilitate this offering. The objectives of Lanier and any selling group may differ from those of the Company, management team, shareholders and investors. As such, Lanier’s and the selling group’s participation in this offering may be influenced by their own interests in current or future fees and commissions that are not necessarily in the best interest of the Company or prospective investors.
9
Table of Contents
Preferred Stock has a liquidation preference over Common Stock
Our preferred stock may be converted into shares of common stock at the discretion of the shareholder. As a general matter, outstanding shares of our preferred stock carry a liquidation preference over shares of our common stock. If an investor chooses to convert its preferred stock into common stock, the holders of the remaining preferred stock would be entitled to a preference over the common stock upon any liquidation of the Company, including the payment of any accrued but unpaid dividends.
Lack of dividends for Common Stock
Our preferred stock may be converted into shares of common stock at the discretion of the shareholder. We do not anticipate paying any cash dividends on common stock in the foreseeable future and intend to retain profits, if any, to finance growth and expansion.
Reservation of proceeds to pay dividends
We currently anticipate reserving a portion of the proceeds of this offering for the payment of quarterly dividends starting the first full calendar quarter following the closing of this offering. The holders of Series B Convertible Preferred Stock are entitled to any accrued but unpaid dividends prior to any other dividend distributions. The reservation of proceeds for dividend distribution to holders of Series B Convertible Preferred Stock and Series D Convertible Preferred Stock will reduce the amount of capital used to finance growth and expansion.
No public trading market for the securities
There is no active trading market for the securities being offered and no market may develop in the foreseeable future for any such securities. If no subsequent market develops, investors may end up with an illiquid investment and not be able to sell or otherwise monetize its stock.
Anti-Takeover Provisions
Our Certificate of Incorporation and Bylaws may make it difficult to effect a change of control and replace incumbent management. Our directors are elected for three-year terms. Advance notice of stockholder nominations for the election of directors must be at least ninety (90) days in advance of the date in which the next annual meeting of stockholders is held. In addition, directors may be removed only for “cause” as defined in the our Certificate of Incorporation, and then only through an action approved by at least two-thirds of the voting power of all of the shares of the Company entitled to vote generally in the election of directors, voting together as a single class. A similar vote is required for stockholders to call a special meeting or to amend the Certificate of Incorporation to amend or repeal any provision related to the Board of Directors. Our Certificate of Incorporation authorizes the Board of Directors to issue preferred stock in classes or series, and to determine voting, redemption and conversion rights and other rights related to such class or series of preferred stock that, in some circumstances, could have the effect of preventing a merger, tender offer or other takeover attempt which the Company’s Board of Directors opposes. Such provisions could also exert a negative influence on the value of our common stock and of a stockholder’s ability to receive the highest value for the common stock in a transaction that may be hindered by the operation of these provisions.
Risks associated with expansion
We plan on expanding our core business through the deployment of capital invested in this offering. Any expansion of operations we undertake will entail risks, and during our expansion we may have inadequate
10
Table of Contents
capital to operate our established business operations. Consequently, investors should assume that (i) such expansion may ultimately involve expenditures of funds beyond the resources available to us at that time, and (ii) management of such expanded operations may divert management’s attention and resources away from our existing operations. These factors may have a material adverse effect on our present and prospective business activities. There can be no assurances our current management team will have the ability to effectively manage our expanded operations, and we may need additional operating capital to hire managers, compliance officers and other administrative persons to manage any expanded operations.
We may need additional capital, which may not be available
We may require funds in excess of our existing cash resources to fund operating deficits, develop new products or services, establish and expand our marketing capabilities, and finance general and administrative activities. Due to market conditions at the time we may need additional funding, or due to our financial conditions at that time, it is possible we will be unable to obtain additional funding as and when we need it. If we are unable to obtain additional funding, we may not be able to repay debts when they are due and payable. If we are able to obtain capital, it may be on unfavorable terms or terms which excessively dilute then-existing equity holders. If we are unable to obtain additional funding as and when needed, we could be forced to delay our development, marketing and expansion efforts and, if we continue to experience losses, potentially cease operations.
Put Agreement for Previously Issued Stock
In connection with a previous private offering of Series D Convertible Preferred Stock, certain investors, that hold 76,637 shares, entered into put option agreements which afford the investors the opportunity, from January 1, 2021 through January 10, 2021 (“Put Exercise Period”), to cause the Company to purchase all or a portion of the applicable Series D Convertible Preferred Stock at approximately $600,000, plus any accrued but unpaid dividends. If, prior to the Put Exercise Period, we are unable to generate sufficient revenue and multiple shareholders exercise their put options, we could face significant financial hardship and may need to incur debt financing, on potentially unfavorable terms, to meet our obligations under these agreements.
In addition, the Company had previously entered into a Put Call Agreement with a holder of 343,136 shares of Series C Convertible Preferred Stock. This Put Call Agreement gave the shareholder the option to require the Company to purchase all, but not less than all, of such Series C Convertible Preferred Stock for $350,000 if the shareholder provided notice of exercise prior to January 11, 2018. On December 18, 2017, the Company received a notice of exercise from the shareholder under the Put Call Agreement which would require the Company to purchase the shares of Series C Convertible Preferred Stock. The Company and the shareholder subsequently entered into an amendment to this Put Call Agreement which extended the deadline for the Company to purchase all of such shares of Series C Convertible Preferred Stock to April 18, 2018. The Company expects to explore potential alternatives to purchasing such shares with the shareholder. If the Company is unable to purchase such shares or secure a negotiated alternative to purchasing the shares, it could adversely affect the Company’s financial results and divert resources from operations.
Reliance on Assets Under Management to Produce Revenue
Our subsidiaries operate investment management, wealth management and investment advisory platforms, which derive fee based compensation based on the amount of assets under management (“AUM”). As a result, we derive a substantial portion of our revenue from fees collected based on the amount of AUM. As a general proposition, if the amount of AUM increases, our revenue increases and vice versa.
AUM is typically a product of the number of investment advisors and managers our subsidiaries are able to recruit and retain and the skill and success of those groups. While we have limited AUM turnover, the concentration of the source of our revenue could disproportionately expose us if our subsidiaries are unable to recruit and retain investment advisors and managers and thus AUM. Market conditions, regulatory exposure and the loss of advisors could cause a reduction in AUM. Although we do not believe we are substantially dependent on any particular advisor, the departure of an advisor responsible for a significant amount of AUM could have detrimental effects on our revenue and the value of an investor’s stock. We believe our compensation system, regulatory expertise, back office support, established succession plan and portfolio management products significantly reduce the risk of losing advisors. However, any loss of AUM would reduce our revenue and potentially inhibit our ability to adequately implement our business growth plans if the loss or losses were significant.
11
Table of Contents
Customer Base and Market Acceptance
While we believe we can develop a customer base through the marketing and promotion of our products and services, our inability to further develop such a customer base could have a material adverse effect on our operations. Although we believe our product and services offer advantages over competitive companies, no assurance can be given that our products and services will attain a degree of market acceptance on a sustained basis or that it will generate revenues sufficient for sustained profitable operations.
Competition
The securities and financial services industries are highly competitive, with many large, diversified, well-capitalized brokerage firms, financial institutions, and other organizations. Competition within the financial services industry is intense, with prospective clients solicited by established Wall Street brokerage and investment management firms offering similar services to prospective clients. Many of these competitors spend significant amounts on advertising to attract the investing public. Many Wall Street firms are better capitalized, have more established reputations, greater marketing experience and prowess, better relationships with investment product suppliers or have other competitive advantages. We expect our competitors to continue to improve the performance of their current products, reduce their prices and introduce new services and technologies that may offer greater performance and improved pricing, any of which could cause a decline in revenue or loss of market acceptance of our products. In addition, our competitors may develop enhancements to, or future generations of, competitive products that may render our services or technologies obsolete or uncompetitive. Competitive pressures may adversely affect us and our prospects.
Regulatory Risks
Our subsidiaries are subject to extensive regulation in the United States, primarily at the federal level, including regulation by the SEC under the Investment Advisers Act of 1940, as amended (the “Advisers Act”) and by the U.S. Department of Labor under the Employee Retirement Income Security Act of 1974 (“ERISA”). The Advisers Act imposes numerous obligations on our subsidiaries including advertising, recordkeeping and operating requirements, disclosure obligations and prohibitions on fraudulent activities.
Accordingly, we face the risk of significant intervention by regulatory authorities, including extended investigation and surveillance activity, adoption of costly or restrictive new regulations and judicial or administrative proceedings that may result in substantial penalties. Among other things, our subsidiaries could be fined or be prohibited from engaging in some of our business activities. The requirements imposed by regulators are generally designed to ensure the integrity of the financial markets and to protect clients and other third parties who deal with us, and are generally not designed to protect our stockholders. Consequently, these regulations often serve to limit our activities, including through net capital, customer protection and market conduct requirements. Moreover, volatility in the U.S. equities markets have led to heightened scrutiny of sophisticated trading technology and execution methods.
Our emphasis on growth coupled with the challenges of managing our business could result in increased exposure to regulatory violations. Although we have implemented, and continue to develop, various internal controls and procedures to prevent violation of applicable rules and regulations, there can be no assurance these controls will be sufficient.
12
Table of Contents
Changes in the Regulatory Environment
The legislative and regulatory environment in which our subsidiaries operate has undergone significant changes in the recent past, including additional filings with the SEC required for investment advisors, which have resulted in increased compliance costs. New laws or regulations, or changes in the enforcement of existing laws or regulations, applicable to us and our clients may adversely affect our business. Our ability to function in this environment will depend on our ability to monitor and promptly react to legislative and regulatory changes. There have been a number of highly publicized regulatory inquiries that have focused on the investment management industry. These inquiries already have resulted in increased scrutiny of the industry and new rules and regulations for investment advisers. This regulatory scrutiny may limit our ability to engage in certain activities that might be beneficial to our stockholders.
The SEC recently announced the formation of a Retail Strategy Task Force (the “Task Force”) to develop effective strategies to address harm to retail investors. The Task Force will work closely with the SEC’s examination staff, as well as the Office of Investor Education and Advocacy and use data analytics to identify areas of risk to retail investors. The Task Force will focus on vigorously pursuing cases against financial institutions and intermediaries. During fiscal year 2017, the SEC obtained orders and judgments totaling $3.7 billion in disgorgement and penalties, brought 754 enforcement actions and barred or suspended more than 625 individuals. The failure of our subsidiaries or their RIAs or IARs to comply with applicable laws or regulations could result in fines, suspensions of individual employees or other sanctions. Even if an investigation or proceeding did not result in a fine or sanction or the fine or sanction imposed against us or our employees by a regulator were small in monetary amount, the adverse publicity relating to an investigation, proceeding or imposition of these fines or sanctions could harm our reputation and cause our subsidiaries to lose existing clients existing accounts, or fail to attract new investors or accounts.
Changes in fiduciary definition
The Department of Labor expanded the “fiduciary” definition under the Employee Retirement Income Security Act of 1974 (“ERISA”) to include persons or entities who provide nondiscretionary investment advice to benefit plans and individual retirement accounts. Changes to ERISA’s fiduciary standards could increase compliance costs and potentially cause significant personal and corporate liability. The practical effects of this change are yet to be determined; however, it could have an impact on our daily operations.
General economic conditions effect on investable income
Our business activities and earnings will be affected by the behavior of individual investors within the United States. General business conditions in the United States, such as short-term and long-term interest rates, inflation, unemployment levels, monetary supply, fluctuations in both debt and equity capital markets, the strength of the United States economy and the local economy in which we operate, global financial market instability, and the risks of a recession and/or prolonged periods of stock market volatility, may reduce the amount of investable income of potential clients and may also influence investors’ behavior in ways we cannot predict, which may be particularly detrimental to our business model.
Possible fluctuations in operating results
Our operating results may fluctuate significantly from period to period as a result of a variety of factors, including investing patterns of customers, competitive pricing, debt service and principal reduction payments, and general economic conditions. Our operating cash flow may vary by quarter due to these fluctuations, which could restrict our ability to pay dividends to shareholders.
13
Table of Contents
Unanticipated obstacles to execution of the business plan
Our business plans may change significantly. Many of our potential business endeavors are capital intensive and may be subject to statutory or regulatory requirements. Management believes our chosen activities and strategies are achievable in light of current economic and legal conditions with the skills, background, and knowledge of our principals and advisors. Management reserves the right to make significant modifications to our stated strategies depending on future events. Investors will not have direct voting control regarding potential changes our business plan.
Management discretion as to use of proceeds
The net proceeds from this offering will be used for the purposes described in “Use of Proceeds.” We reserve the right, however, to use the funds obtained from this offering for other similar purposes not presently contemplated which we deem to be in the best interests of the Company and our shareholders in order to address changed circumstances or opportunities. As a result of the foregoing, our success will be substantially dependent upon the discretion and judgment of management with respect to application and allocation of the net proceeds of this offering. Investors in the offered securities will be entrusting their funds to our management, upon whose judgment and discretion the investors must depend.
Control by Management
As of the commencement of this offering, our executive officers and directors own more than 50% of the outstanding voting securities. Each share of the Series D Convertible Preferred Stock offered hereby will have one vote per share for all actions that require common stockholder approval and as such may have the ability to vote to remove any member of the Board of Directors. However, if only a portion of this offering is purchased, the executive officers and directors may maintain voting control of the Company. Accordingly, and because there is no cumulative voting for directors, our executive officers and directors may be in a position to control the election of the directors of the Company and to control our business and operations through their stock ownership, positions on the Board of Directors and management roles.
Dividend Policy
A holder of the Series D Convertible Preferred Stock offered hereby will be entitled to receive dividends only when, as, and if declared by the Board of Directors out of funds legally available. Our Board of Directors will determine the dividend policy based upon our results of operations, financial condition, capital requirements, and other circumstances. Additionally, prior to distributing dividends to holders of the offered securities, we must pay all accrued but unpaid dividends to holders of Series B Convertible Preferred Stock. As of December 31, 2017, the accumulated but unpaid dividends on the outstanding Series B Convertible Preferred Stock was $226,970. Although we anticipate a large amount of the Series B Convertible Preferred Stock will be exchanged for Series D Convertible Preferred Stock, there can be no assurances that such exchanges will occur and based on the financial position of the Company prior to this offering, without giving effect to any proceeds to be received from this offering, we may be undercapitalized and unable to pay dividends until our financial position is improved.
No assurances of protection for proprietary rights; Reliance on trade secrets
In certain cases, we may rely on trade secrets to protect proprietary technology and processes which we have developed or may develop in the future. There can be no assurances that secrecy obligations will be honored or that others will not independently develop similar or superior technology. The protection of proprietary technology through claims of trade secret status has been the subject of increasing claims and litigation by various companies both in order to protect proprietary rights as well as for competitive reasons
14
Table of Contents
even where proprietary claims are unsubstantiated. The prosecution of proprietary claims or the defense of such claims is costly and uncertain given the rapid development of the principles of law pertaining to this area. We may, like other firms, also be subject to claims by other parties with regard to the use of technology information and data which may be deemed proprietary to others.
Cybersecurity
We are, and our service providers are, susceptible to operational, information security and other cybersecurity risks, both directly and indirectly through their certain third parties. Similar types of cybersecurity risks are also present for issuers of securities in which our IARs invest, which could result in material adverse consequences for such issuers and may cause clients’ investment in such portfolio companies to lose value. These risks may not be covered by insurance. In general, cybersecurity incidents can result from deliberate attacks or unintentional events. Cyber-attacks include, but are not limited to, gaining unauthorized access to digital systems (e.g., through hacking or use of malicious software coding) for purposes of misappropriating assets or sensitive information, corrupting data, or causing operational disruption. Cyber-attacks may also be carried out without ever obtaining direct access to the targeted systems, such as through a denial-of-service attack which could result in the target’s network services becoming unavailable to its intended users. Cybersecurity failures by, or breaches of, the systems of the Company, IARs and other service providers (including, but not limited to, data providers, accountants, custodians, transfer agents and attorneys), market makers or the issuers of securities in which the IARs invest, could cause disruptions and impact business operations, potentially resulting in one or more of the following: material financial losses, unintended disclosure of confidential trading information, material impediments to trading, submission of erroneous trades or redemption orders, the inability of the Company or its service providers to transact business, violations of applicable privacy and other laws, regulatory fines, penalties, reputational damage, reimbursement or other compensation costs, or additional compliance costs. In addition, cyber-attacks may render inaccessible, inaccurate or incomplete any or all of the records of our assets, transactions, ownership of offered securities, and other data integral to our functioning. We may have to incur substantial costs in order to prevent or address cyber-incidents in the future. We have established a cybersecurity policy and business continuity procedures to address and mitigate these cybersecurity risks. Despite these efforts, certain risks may not yet have been identified and it is possible that prevention and remediation efforts will be inadequate or unsuccessful. Additionally, because techniques used to obtain unauthorized access or to sabotage systems change frequently and generally are not recognized until launched against a company, we may be unable to anticipate these techniques or to implement adequate preventive measures. Furthermore, we are unable to directly control the cybersecurity procedures and systems of any service providers, and the shareholders could be materially and adversely impacted as a result.
Litigation
There is no pending or threatened litigation against us at this time. We expect that, from time to time in the future, we may be engaged in routine litigation incidental to operating a business. Legal proceedings, even frivolous proceedings, can be costly and time consuming. The cost of any litigation would reduce the amount of expansion capital available to us and may materially impact the value of the offered securities.
Terrorist attacks or other acts of violence or war may affect our industry, operations and profitability
Terrorist attacks, whether local, national or international, may harm our results of operations and an investor’s investment as a result of fluctuations in the investing environment. There can be no assurance there will not be more terrorist attacks against the United States, U.S. businesses or key U.S. allies. These attacks or armed conflicts may directly or indirectly impact the value of our stock. Moreover, any of these
15
Table of Contents
events could cause consumer confidence and spending to decrease or result in increased volatility in the United States and worldwide financial markets and economy. They could also result in economic uncertainty in the United States or abroad. Any uncertainty in the U.S. markets may affect the amount of investable income of potential clients and may also influence investors’ behavior in ways we cannot predict, which may be particularly detrimental to our business model.
16
Table of Contents
Private Offering
Prior to this offering’s effective date, the Company conducted an offering relying on the exemption provided in Regulation D 506(c) to sell shares of Series D Convertible Preferred Stock to accredited investors. During the prior private offering, 76,637 shares of our Series D Convertible Preferred Stock were acquired for a discounted purchase price under two scenarios: (i) clients of RIAs purchased the offered securities for a seven percent (7%) discount for their client’s accounts; and (ii) clients of broker-dealers purchased the offered securities for a fifteen percent (15%) discount.
Future Dilution
We, for business purposes, may from time to time issue additional shares, which may result in dilution of existing shareholders. Dilution is a reduction in the percentage of a stock caused by the issuance of new stock. Dilution can also occur when holders of stock options (such as company employees) or holders of other convertible securities, such as warrants, exercise these convertible securities. When the number of shares outstanding increases, each existing stockholder will own a smaller, or diluted, percentage of a company, making each share less valuable. Dilution may also reduce the value of existing shares by reducing the stock’s earnings per share. There is no guarantee that dilution of the offered securities will not occur in the future.
17
Table of Contents
We are offering shares of our Series D Convertible Preferred Stock to investors in this offering. The Series D Convertible Preferred Stock may be converted into shares of our Common Stock at the discretion of each investor. As such, we are qualifying up to 2,000,000 shares of Series D Convertible Preferred Stock and up to 2,000,000 shares of Common Stock under this offering statement, of which this offering circular is a part.
The Company has engaged Lanier Securities, LLC as a placement agent (the “Placement Agent” or “Lanier”). The Company entered into an engagement letter with the Placement Agent, which defined the terms and conditions of its association with this offering. We will pay Lanier seven percent (7%) of the gross proceeds of the offering, one percent (1%) of gross proceeds of the sale for unaccountable expenses and will reimburse for up to $5,000 in out-of-pocket expenses. We also paid Lanier $25,000, payable in five monthly installments, upon the execution of the engagement letter related to early stage due diligence. Lanier will provide financial advice related to the offering, and establish a selling group and marketing plan to sell the offered securities.
We have engaged Prime Trust Federal Credit Union as an escrow agent. All proceeds from the sale of Series D Convertible Preferred Stock will be deposited in an escrow account for further transfer to us upon acceptance of the subscription agreement. Since there is no minimum amount of securities that must be purchased in this offering, all accepted and approved subscription proceeds will be available to us after release from escrow and no investor funds will be reimbursed if the proceeds of this offering are insufficient to cover the costs of the offering.
We have obtained a Committee on Uniform Security Identification Procedures (CUSIP) number and anticipate applying for Depository Trust Company (DTC) eligibility; however, a trading market for the Series D Convertible Preferred Stock may never develop.
18
Table of Contents
The following section is based on estimates by management. Our actual use of the proceeds may differ depending on the exact amount invested in the offering and any foreseen or unforeseen changes to our operating landscape.
SALE OF EQUITY
| Category |
Max Proceeds | |||
| Proceeds from Sale of Shares |
$ | 20,000,000 | ||
OFFERING EXPENSES & COMMISSIONS
| Category |
Max Proceeds | |||
| Expenses1 |
$ | 350,000 | ||
| Brokerage Commissions2 |
$ | 1,400,000 | ||
| TOTAL OFFERING FEES |
$ | 1,750,000 | ||
CORPORATE APPLICATION OF PROCEEDS
| Category |
Max Proceeds | |||
| Repay or Exchange Senior Debt3 |
$ | 625,000 | ||
| Other Debt Repayment |
$ | 1,500,000 | ||
| Redeem or Exchange Series B and Series C Convertible Preferred Stock4 |
$ | 1,150,000 | ||
| Reservation of Proceeds for Dividend Payments5 |
$ | 1,400,000 | ||
| Technology Development & Investment |
$ | 2,000,000 | ||
| Acquisition & Growth Capital |
$ | 11,350,000 | ||
| Legal & Accounting |
$ | 225,000 | ||
| TOTAL CORPORATE USE |
$ | 18,250,000 | ||
| 1 | Includes estimated offering circular preparation, filing, printing, investor portal, web development, marketing and other fees and expenses related to the offering. |
| 2 | Registered broker or dealers who are members of the FINRA and who enter into a participating dealer agreement with the Company may sell offered securities. Such brokers or dealers may receive commissions up to seven percent (7%) of the price of the offered securities sold. Offered securities purchased by an RIA for clients will have the purchase price reduced by 7%, as no commissions may be paid to investment advisors. |
| 3 | Affiliates of our Company hold approximately $150,000 of our outstanding Senior Secured Notes. |
| 4 | If we are unable to negotiate an alternative to the requirement to purchase certain shares of Series C Convertible Preferred Stock pursuant to the Put Call Agreement, as amended, we anticipate using $350,000 to purchase the 343,136 shares required by such agreement. |
| 5 | Includes the reservation of dividends for one-year on the Series D Convertible Preferred Stock and potential accrued but unpaid dividends on any unexchanged Series B Convertible Preferred Stock. |
19
Table of Contents
TOTAL USE OF PROCEEDS
| Category |
Max Proceeds | |||
| Offering Expenses & Commissions |
$ | 1,750,000 | ||
| Corporate Application of Proceeds |
$ | 18,250,000 | ||
| TOTAL PROCEEDS |
$ | 20,000,000 | ||
OUR ACTUAL USE OF PROCEEDS MAY DIFFER DEPENDING ON THE BUSINESS AND REGULATORY LANDSCAPE.
Exchange or Repay Senior Secured Notes. We expect the holders of a significant amount of our 8% Senior Secured Notes will exchange their Notes for shares of the Series D Convertible Preferred Stock. Notes that are not exchanged will be paid off as a portion of the use of proceeds in this section. Management expects to negotiate discounted settlements with other debts and liabilities of the Company. Affiliates of the Company hold approximately $150,000 of our outstanding Senior Secured Notes.
Holders of our Series B Convertible Preferred Stock will also have an opportunity to exchange their Series B Convertible Preferred Stock for shares of Series D Convertible Preferred Stock. We expect a significant portion of the Series B Convertible Preferred Stock to exchange into the Series D Convertible Preferred Stock.
Technology Investment & Development. We intend to make investments in technology to put us on the “cutting edge” with other nationally recognized RIA and wealth management firms.
Dividend Reserve Account. We intend to keep segregated in a separate account the funds necessary for the payment of dividends on the Series D Convertible Preferred Stock and any outstanding Series B Convertible Preferred Stock for the first year, which we believe will provide ample time for us to reach a sustainable level of profitability to service the dividend payments from profits of the Company.
Acquisition & Working Capital. Our sales and business development team at IWA has a pipeline of prospective new recruits and acquisition candidates. The Board of Directors is also considering the purchase of ILA from Mr. Moore after a fair market analysis is competed. In addition, we have developed a growth and acquisition plan for the next four years that allocates a portion of the proceeds to acquisition and aggregation of other smaller RIAs and IARs into IWM and IWA. We believe this will accelerate our growth and acquisition program, thus expanding our footprint from a regional mini-aggregator into a $5-10 billion-plus national super-aggregator.
If this offering is fully subscribed, the capital will serve to accelerate our growth plans. Additionally, we have the internal money management expertise to safely invest the excess funds at favorable risk-adjusted returns until additional acquisition opportunities are realized.
Potential Interested Transaction.
The Company has considered and will consider acquiring the ILA from Dewey M. Moore, Jr. Any transaction will be conducted on an arms-length basis for a price determined by an independent third-party evaluation and must be unanimously approved by the independent members of the Board of Directors.
20
Table of Contents
Institute for Wealth Holdings, Inc.
Summary:
Our company is the result of a successful merger in 2016 of the Institute for Wealth Management, LLC, which was founded by Matthew D. Medeiros in 2003, and Institute for Wealth Holdings, Inc., formerly Cherry, Inc., which was founded in 2008 by Dewey M. “Rusty” Moore, Jr. Both of our founders are experienced investment professionals who have demonstrated proven skills, excellence in leadership in the development of innovative products and services, and superior team building capabilities in launching successful companies.
IWM, IWA and IWC operate a dual RIA platform utilizing our proven management team to recruit and train associate investment advisers and IARs to gather AUM under a successful, client-centric national brand. We provide, through multiple custodians, a single client interface for the administration, execution and reporting for client accounts, and offer advisers online access to fee tracking and payments. Our business model separates the money management functions from the advisor marketing functions with added degrees of separation from clients’ AUM, reducing compliance risk and allowing for higher productivity by providing our advisors and IARs more time to focus on existing client relationships and prospective new clients. Our company enjoys an excellent business reputation. Since their inception, neither IWM, IWA nor their affiliates have had an unresolved customer complaint.
Our training process for advisers is structured to provide templates, support, resources, coaching and guidance for greater client retention and growth. When each new advisor joins us, the advisor receives an overview of IWM’s wealth management portfolios, policies and procedures, advertising and marketing guidelines, client enrollment materials and other information to support the advisor’s client development efforts.
Our Growth:
Our 2016 merger was our first major step to expand our national brand and increase our AUM. The merger with IWM provided us with an expansive platform, proprietary wealth management strategies, experienced leadership team, an improved technological infrastructure and a proven portfolio management philosophy.
The merger also provided us with a broader platform from which we can acquire independent IARs and smaller RIAs, and “on-board” each new advisor efficiently and effectively. The growth capital sought by this offering is intended to, in part, accelerate our management team’s ability to execute our growth plans to expand from a regional mini-aggregator, to a national $10 billion-plus super-aggregator of AUM supporting over 200 IARs and tens of thousands of clients.
Our leadership is focused on implementing this growth strategy and we have added twenty new investment advisory professionals over the first half of 2017 alone. Our AUM has increased from under $200 million on December 31, 2016, to approximately $500 million by March 2017, over $750 million at the end of June 2017, and $890.1 million as of the end of December 2017. Since December 31, 2015, on a pro forma basis, our total revenue has increased at a CAGR of 91% and AUM has grown at a CAGR of 104%. Although this indicates robust economic growth, our management team anticipates continued rapid development and growth if we are able to obtain the expansion capital necessary to acquire new advisors and AUM.
21
Table of Contents
Our future marketing and growth plans focus on five primary distribution channels, as aligned to our own core competencies and anticipated market opportunity:
| 1. | Organic AUM Growth – We grow our AUM organically through the application of our portfolio management strategies for our clients. We grow as our clients’ assets grow. There are three phases of clients’ wealth management: (1) accumulation phase, (2) preservation phase and (3) distribution phase. Most of our clients are in the accumulation and preservation phases. We also gain AUM as we consolidate more of a client’s assets held at other firms and from inter-generational transfers, as clients receive inheritances from their parents. |
| 2. | Third-Party Broker/Dealer & RIA Network – The IWM business model has historically been to target market existing broker/dealers and independent RIAs. This strategy has been successful as IWM currently has selling agreements with more than 100 firms which offer IWM’s portfolio management services as a third-party money manager to their representatives, constituting more than 20,000 representatives. Approximately $200 million in AUM is currently a result of this network channel. IWM expects to expand its marketing efforts to this channel by hiring of additional internal wholesalers and sales representatives. |
| 3. | Robo-Advisor Portal – The proprietary software development of this proposed Robo-Advisor portal for self-directed clients began in 2010 and postponed until adequate funding could be secured for its completion. A portion of the proceeds from this offering are to be allocated to the completion of its development. When completed, this portal will allow subscribers to screen stocks for inclusion in their customized portfolios, with access to news, research and other features automatically generating risk-based profiles and suitable IWH investment program solutions according to each client’s objectives. This may provide opportunities for advisors with smaller clientele, and smaller accounts size in AUM as well as draw new direct clients to the firm who are self-directed online investors. The Company will also use this technology internally as proprietary stock screening tool in the research and selection of stocks for inclusion in various portfolios. |
| 4. | Recruiting and Business Development – IWA’s business model is primarily focused on expanding distribution by recruiting new IARs and onboarding them onto our platform and into our organizational culture. Everyone in the IWH organization, from the CEO to the IARs, are incentivized to recruit quality IARs. IWA also uses internal as well as external recruiters to execute its plan. Proceeds from this offering with enhance and expand IWA’s opportunity to recruit new IARs and onboard them and their clients into our business organization. |
| 5. | Mergers & Acquisitions – We intend to acquire smaller to medium sized RIAs and independent IARs by merging them into IWM and IWA. Many aging advisors planning for retirement are seeking a succession plan for their firms and for their clients. (See “Seasoned Advisors Aging-Out” on Page 35). IWM and IWA are well positioned to assist in the planning and transition for these professionals. A significant portion of the use of the proceeds from this offering will enhance and expand our ability to acquire and onboard them and their clients into our business organization. |
22
Table of Contents
Our Products:
We have competitive advantages as a result of our management philosophy, proven leadership, our proprietary wealth management products and technologies and our scalable investment architecture. All of our wealth management strategies are developed and managed internally, and we are therefore not dependent on using “outside” or third-party money managers. This adds to IWM’s profit center and also provides our IARs a cost effective advantage, as most independent RIAs and IARs must either hire outside money managers for a portion of the fees they charge, which cuts into their profitability, or they attempt to manage client account assets themselves. Very few independent RIAs and IARs are successful with this approach.
Through selective recruiting of advisors, we believe we are in a position to optimally manage and support the activities of our prospective advisors, providing them with our proprietary wealth management portfolios and advisor support platform as compared to smaller to mid-sized traditional RIAs that are faced with the challenges of trying to do it all themselves. The merger with IWM provided us with the brand, the advisor support platform and proprietary wealth management products to recruit or to acquire less profitable advisors and reform them into successful advisors. Our operations are dependent on the ability of our management team to recruit, manage and train enthusiastic investment advisers.
Our technology allows us to manage each of our proprietary portfolio strategies through the management of a single model for each portfolio strategy. We are then able to allocate those efficiently and cost effectively as Separately Managed Accounts (“SMAs”) across hundreds or thousands of our client accounts. These SMAs function like mutual funds, but without the costs, fees and constraints required by the mutual fund industry, thus giving our clients a lower cost, more efficient actively managed account, presumably with a greater upside potential. Our proprietary wealth management products and SMAs offer a differential advantage for our IARs and clients. These products include the following:
| • | IWM MoneyPlus: The IWM MoneyPlus strategy invests solely in cash, fixed income mutual funds and ETFs. While seeking a lower duration than traditional bond benchmarks, this strategy may incorporate cash, U.S. treasuries, government-related debts, corporate bonds, securitized bonds, derivatives and global fixed income securities. |
| • | Guaranteed Income Edge Portfolios: Our Guaranteed Income Edge Portfolios offer an optional 4 or 5% guaranteed income benefit for life (combined with an insurance certificate from a financial institution). |
| • | Signature 5 Series Portfolios with Partial Downside Protection: Our Signature 5 Series Portfolios are “Partially Protected” portfolios (backed by issuing bank). The unique component of the protected portfolios is that a portion of each portfolio has a buffer of protection of up to 20% on either 50% or 75% of the portfolio. The remainder of the portfolio remains diversified to offer an additional safety net against potential losses. These portfolios are intended to be held until maturity (currently 3 to 4 years). |
| • | Aspire Portfolios: Our Aspire Portfolios provide global allocations with downside protection. These portfolios feature the same best ideas, factor exposures and oversight as our Global Tactical Asset Allocation program, including allocations suitable across the goals and objectives spectrum. The portfolios are built around our proprietary dynamic selection models for growth versus value stocks and fixed income, designed to perform well in both bull and bear markets. |
23
Table of Contents
| • | Cherry Value: Our Large Cap Domestic Equity Stock portfolio consisting of stocks selectively managed based on a value investing philosophy and processes with the belief that quality, high yielding companies when acquired at a discount with a margin of safety to their intrinsic values offer investors superior risk-adjusted returns over the long term. The Cherry Value SMA benchmark is the S&P 500. |
| • | Cherry International: Our Mid to Large Cap International Equity Stock portfolio managed by investing abroad in stocks of quality foreign companies, selectively managed based on a value investing philosophy and processes with the belief that quality, high yielding foreign companies when acquired at a discount with a margin of safety to their intrinsic values offer investors superior risk-adjusted returns over the long term. The Cherry International SMA benchmark is the Morgan Stanley’s MSCI EAFE Index. |
| • | Cherry Dividend & Income: Our Large Cap Global Equity Stock portfolio consisting of stocks selected and managed for capital preservation and long term yield from quality blue chip companies based on a value investing philosophy and processes with the belief that quality, high yielding companies when acquired at a discount with a margin of safety to their intrinsic values offer investors superior risk-adjusted returns over the long term. The Cherry Dividend & Income SMA benchmark is the Dow Jones Global Dividend Index. |
Our investments strategies have significant track records of producing meaningful risk-adjusted returns, remaining focused on the overall strategy of managing a client’s risk first and returns second. Our various strategies include the following:
| • | Global Strategic: These are passive, strategic asset allocation portfolios constructed from the Vanguard family of mutual funds and ETFs, managed on a discretionary basis by a portfolio manager who determines the asset allocation and selects Vanguard funds for each investment style component of the portfolios based on proprietary modeling strategies. |
| • | Global Tactical Asset Allocation (GTAA): Our GTAA portfolios are managed using a research-driven process that analyzes prospective managers and their research in order to select a blend of best-of-class research partners that produce above-average, long-term returns while also reducing the likelihood of uncomfortable, short-term surprises. Concurrently, the GTAA strategy, similar to the objectives of many large endowments, manages risk first and pursues returns second. |
| • | Sector Rotation: Our active, tactical management strategy designed to capture a proportionate share of S&P 500 upside in bull markets while also seeking to reduce participation in bear markets by holding above-average cash or money market balances. Proprietary quant-based entry and exit criteria are used to manage risk, determine sector weightings and determine when to increase or decrease cash/money market balances. |
| • | Unconstrained Long/Short: This is an active, tactical management strategy that uses technical analysis to pursue above-average, risk-adjusted returns with lower volatility relative to the market. |
| • | Socially Responsible Investor (SRI): Our SRI models provide a solution for investors interested in socially responsible equities. IWM uses its institutional style investing to provide a socially responsible solution through an investment universe selected by Morningstar (a leading expert in socially responsible investments). |
24
Table of Contents
Structure of Institute of Wealth Holdings
|
|
The Institute for Wealth Holdings, Inc. |

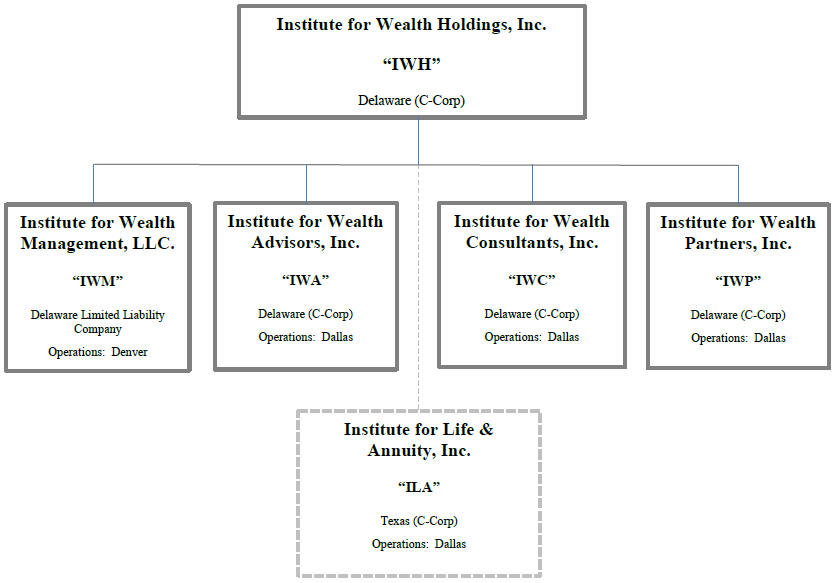
Our core competencies align with our mission to provide a comprehensive suite of premier client and advisor-centric services. Our diversified services platform and our multiple channels of distribution also
25
Table of Contents
provide the opportunity for multiple revenue streams to IWH divided in four (4) major components. We derive revenues from: (1) IWM’s portfolio and wealth management services, (2) IWA’s advisor support in practice management, coaching & development, back-office services & technology, (3) financial planning, and (4) life insurance and annuity offerings, all more specifically described below.
Portfolio & Wealth Management. Our investment philosophy is based on managing risk first and returns second. Our investment management arm has over forty strategies with significant track records, providing the full spectrum of investment options necessary for any practice, some of these are outlined in the preceding paragraph. By offering these same solutions to various outside broker-dealer and third-party asset management platforms, we are also able to effectively leverage our intellectual property, generating revenue from assets held away from our direct platforms.
Practice Management, Coaching & Development. Each advisor is encouraged to work one-on-one with an experienced investment manager or coach to learn important aspects of the business, while focusing on the individual advisors’ strengths and weaknesses. By doing so, we are able to create a personalized plan to improve their overall practice management objectives. This hands-on management increases our appeal to break-away prospects, while simultaneously increasing current AUM for an advisor and the firm.
Back-Office Service & Technology. Through direct investments in technology and close partnerships with allied firms, our technology platform allows advisors to spend more time with their clients and less time administrating each account. Our back office team actively supports new advisors allowing them to focus on client development and asset management, as most independent advisors must spend approximately fifty percent (50%) of the time conducting back-office services. We also feature strong relationships with each of the major custodians to provide world-class client and advisor choice.
A Financial Planning Focus. We provide financial planning services to help advisors and IARs focus on providing a more comprehensive advisory service to clients, thereby enhancing their client relationships. Our financial planning division helps advisors perform at a higher level of service to clients, and ultimately gather more AUM, additional fee based income and uncover estate planning needs for life insurance and annuities. This capability and support for IARs and clients is available to advisors through a service support desk, a dedicated para-planner to enter the clients’ data as well as a customized and IWM branded software platform with a virtual cloud storage component.
Licensed Insurance Agency Solutions. Our IARs have access to ILA, our corporate insurance agency affiliate of IWH, to offer life insurance and annuity products to their clients. Having a breadth of non-investment solutions, such as expertise and access to diversified life insurance and annuity products, means helping clients with risk management, estate planning, retirement planning and other complex life and annuity strategies to complement their full wealth management and life planning goals. Additionally, our Agency offers additional revenues for the Company and for our advisors and IARs.
Why we believe IWH will continue to grow and thrive as a successful company:
We have clear, executable growth strategies that are focused on expanding our network of IARs and growing our AUM. Since our 2016 merger, we now appeal to a much broader base of successful advisors across the country. Further, because our RIA subsidiaries are registered with the U. S. Securities and Exchange Commission, (“SEC”) rather than on a state by state basis, we can enter a new state and recruit new IARs in that state with a simple notice filing in most cases.
26
Table of Contents
We believe we can continue our rapid growth and expansion over the next few years, due to the following:
| • | Advisors in the investment industry are moving from Broker/Dealer commissions to RIA fee based compensation models in which IWH already has an established market share. |
| • | Cerulli Associates forecasts that independent RIAs will control more assets than all brokerage firms by 2020. |
| • | The compliance costs and regulatory complexity (such as the recently implemented Department of Labor fiduciary rule) inhibits independent IARs and small RIA firms, and therefore presents us with merger and acquisition opportunities. |
| • | We are a fully integrated dual RIA and investment management platform that is well positioned to capitalize on these trends. |
| • | IWM’s multiple custodians; e.g.: TD Ameritrade, Schwab, Fidelity, Pershing, Folio Institutional, Kingdom Trust, and others provide easy avenues for IARs and clients to move to IWM. |
| • | We believe that with the growth and acquisition capital from this offering we have the ability to acquire small RIAs and independent IARs to grow our AUM to $5-10 billion. |
| • | We believe RIAs with under $100 million in AUM need to join affiliated organizations with a larger platform that can provide technology, compliance and systems required in an increasingly complex and competitive financial system. |
| • | We have begun an aggressive acquisition program, finding smaller RIAs eager to join an organization with superior technology and compliance capabilities. |
| • | We have a 104% CAGR in combined AUM since December 31, 2015. |
| • | IWA’s succession plan program allows retiring IARs to sell their client relationships & AUM to IWH for cash plus an “earn-out” based on performance. |
| • | We will solicit break-away brokers and independent IARs who would prefer a fee-based advisory model to merge their firm into IWM, IWA or IWC. |
| • | IWA has an active recruitment program using third-party recruiting firms for which we pay a fee for the onboarding of qualified candidates. |
27
Table of Contents

As shown above, since our merger with IWM, we have been able to rapidly accumulate AUM.
28
Table of Contents

Consistent with our AUM growth, since the merger with IWM, we have seen an increase in revenue, as shown above.
29
Table of Contents

Access to acquisition and growth capital will allow us to acquire smaller RIAs and independent IARs, which will result in a growth in AUM, as projected above. We believe that with increased capital, we can acquire additional RIAs and IARs and effectively incorporate their clients and AUM into our companies.
30
Table of Contents
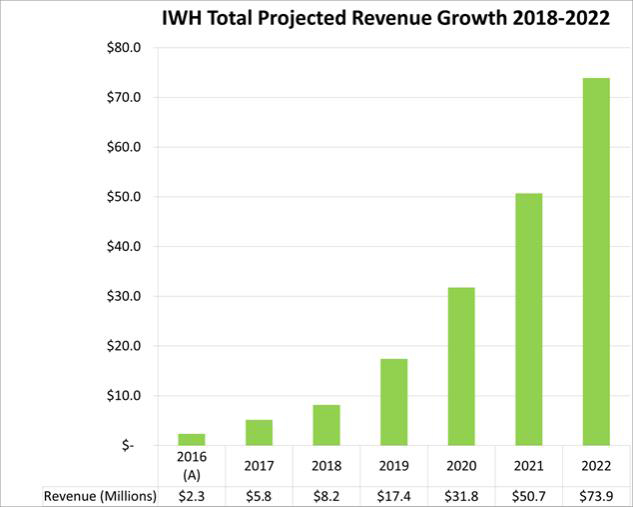
If we are able to expand our AUM through the expenditure of growth capital, our revenue should correspondingly increase, as projected above.
The basis for the projections above regarding AUM and revenue growth were developed by the Company’s executive management team, members of IWM’s investment committee and IWH’s investment banker. This team developed a comprehensive business plan and growth model for the years 2017 to 2022. The Company’s model is developed from industry research and assumptions based on industry trends and valuation metrics as well as a result of our historical business experience and past performance. The business plan and growth model and our future marketing and growth plans (see Page 21) focus on four of our five primary distribution channels, as aligned to our own core competencies and planned market opportunities. The plan and model does not include our planned Robo-Advisor Portal, since it is a planned development and is untested. These four distribution channels as represented in our business plan and growth model include:
| 1. | Organic AUM Growth – Our model assumes a five percent (5%) annual growth rate of existing AUM as we grow organically through the successful application of our portfolio management strategies for our clients. AUM grows as our clients’ assets grow. There are three phases of clients’ wealth management: (1) accumulation phase, (2) preservation phase and (3) distribution phase. Most of our clients are in the accumulation and preservation phases. We also gain AUM as we consolidate more of a client’s assets held at other firms and from inter-generational transfers, as clients receive inheritances from their family. |
31
Table of Contents
| 2. | Third-Party Broker/Dealer & RIA Network – The IWM business model has historically been to target market existing broker/dealers and independent RIAs. This strategy has been successful as IWM currently has selling agreements with more than 100 firms which offer IWM’s portfolio management services as a third-party money manager to their representatives, constituting more than 20,000 representatives. Approximately $200 million in AUM is currently a result of this network channel. Proceeds from the offering will allow IWM to expand its marketing efforts to this channel with the hiring of additional internal wholesalers and sales representatives. |
| 3. | Recruiting and Business Development – Our growth plan model’s recruiting distribution channel is primarily focused on expanding distribution by recruiting new IARs and onboarding them onto our platform and into our organizational culture. Most everyone in the IWH organization, from the CEO to the business development team, including the IARs, are incentivized to recruit quality IARs to the Company. IWA also uses internal as well as external recruiters to execute its plan. Proceeds from this offering will enhance and expand IWA’s use of incentives and signing bonuses opportunity to recruit new IARs and onboard them and their clients into our business organization. |
| 4. | Mergers & Acquisitions – Our business plan and growth model anticipates the use of proceeds from the offering to acquire smaller to medium sized RIAs and independent IARs by merging them into IWM and IWA. Many aging advisors planning for retirement are seeking a succession plan for their firms and for their clients. (See “Seasoned Advisors Aging-Out” on Page 35). IWM and IWA are well positioned to assist in the planning and transition for these professionals. A significant portion of the use of the proceeds from this offering will enhance and expand our ability to acquire and onboard them and their clients into our business organization. |
| 5. | Other Assumptions – Earnings Excess Cash – IWH earnings on un-deployed, excess cash reserves assumes a two (2%) return on an annualized basis. |
Management Team:
We host a growing team of experienced, top-tier managers and financial professionals. Members of our team have led publicly-traded financial companies through numerous private equity and merger transactions and have managed pensions, endowments, and some of the most cutting-edge portfolios on the market today.
We operate through four functional teams:
Executive Management Team – Our executive management team is generally responsible for, together with the Board of Directors, establishing and maintaining our vision and mission and our values, setting our strategy, growing profitably, developing our people and managing the financial, budgets, major projects, and structure of the organization. The executive management team handles major administration policies and human resource matters as well. The executive management team consists of:
D. M. Rusty Moore – IWH Chairman and President of IWA; and
Matthew D. Medeiros – IWH Executive Vice President and President of IWM.
Investment Management Team – IWM Investment Committee & Capital Markets Team – Our investment management team is responsible for the creation, maintenance, performance and risk management
32
Table of Contents
attributes of IWM’s forty proprietary investment models and products, portfolio management strategies and separately managed accounts. Each portfolio manager reports to and is held accountable by the investment management team. They meet at least weekly to review evolving market dynamics, portfolio and strategy performances and recommended changes. The investment management team consists of:
Matthew D. Medeiros – Chief Investment Officer and IWM Investment
Committee Chairman;
Jeffrey Pietsch, JD, CFA – Senior Portfolio Manager, Head of Capital Markets;
Creg Shaffer – Chief Economist; and
D. M. Rusty Moore – Member, Value Portfolio Strategist.
Operations Team – Our operations team is responsible for implementing our mission and strategies established by the Board of Directors and executive management team, and for executing our day-to-day tactical plan, policies and procedures. In particular, the operations team oversees our financial reporting, treasury and compliance functions, and coordinates and manages staff members to efficiently and cost effectively manage across inter-company lines. The operations team leaders consist of:
Matthew D. Medeiros – Chief Executive Officer of IWM;
Jeffrey Jorgensen – Chief Operations Officer of IWM;
Donald Schulz, CPA – Chief Financial Officer of IWH; and
T. Scott Brooks – Compliance Consultant for IWA.
Sales, Marketing & Business Development Team – Our sales, marketing & business development team is responsible for RIA acquisitions, mergers, business development recruiting new IARs, relationships with our existing RIAs and broker-dealers, and attracting new relationships with RIAs, services and product offerings. The sales, marketing & business development team leaders consist of:
D. M. Rusty Moore – CEO, President of IWA
Matthew D. Medeiros – CEO and President of IWM; and
John H. Moore, III – Managing Director of National Recruiting.
Services Team – Finally, the above team leaders and our six (6) other support staff members currently make up a total of fourteen full-time and part-time support staff and operations employees who are ready to assist our growing advisor base with their daily administrative and practice management needs. With the exception of the CEO and CFO, all employees are employed either at IWM or IWA, with several that serve across inter-company lines.
For biographies of our executive officers, directors and other significant employees, see “Directors, Officers and Significant Employees.”
Investment Management Industry:
Industry Trends:
| 1. | A Multitude of Changes. |
The wealth management industry around the world is witnessing a multitude of changes due to weak economies in the developed world, strong growth in developing markets like China and India, uncertain political future in Europe, increasing regulatory supervision, and new competition from rising FinTechs and their innovative services for High Net Worth Individuals (HNWIs).
33
Table of Contents
| 2. | Continued Focus on Cybersecurity in Light of Increasing Digitization. |
With evolving digitization in the industry, more customers and asset managers are leveraging the power of massive amounts of financial information for real-time asset and portfolio management. This means that there are proprietary and third-party services that have access rights to clients’ and firm’s financial information in order to provide the end-user a window into their investment performance and management.
| 3. | Increasing Collaboration between Incumbents and FinTechs. |
FinTechs are making inroads throughout the wealth management lifecycle by innovating standard wealth management functions ranging from client acquisition and advice, to compliance. New FinTech offerings, including automated advice platforms, open investment communities, and third-party capability plug-ins are increasingly being embraced for HNWIs as alternatives to traditional face-to-face advice.
| 4. | Increasing Application of Artificial Intelligence-Based Analytics Solutions. |
Wealth management firms of all sizes are harnessing the power of artificial intelligence and analytics to enable faster decision making by wealth managers. Using automated platforms provides cost benefits for the companies in the long run as they are able to replace existing legacy infrastructure with a more efficient data management platform.
| 5. | Growing Demand for Digital Tools by Wealth Managers. |
For decades, the wealth management industry has been resistant to transformative digital technology, but now, driven by the changes in client behaviors, wealth managers are demanding digital capabilities. Wealth managers, including those who may have been reluctant, are embracing digital tools to compete with technology-enabled advisory services.
| 6. | Evolution of New Fee Models. |
Traditionally HNWIs have been paying for the wealth services they avail on the basis of their assets under management, but now their preference for fee structure is changing, such as paying according to investment performances. Also, the investment management model has evolved from a pure transaction-based model to a more holistic goals-based financial planning model.
| 7. | Intergenerational Wealth Transfer Remains a Significant Growth Opportunity. |
Approximately $10 trillion of wealth transfers will take place in the U.S., Germany, and Japan. China is also expected to witness a significant intergenerational wealth transfer after tremendous HNWI wealth growth over the past decades of robust economic growth. Many young people inheriting their parents’ assets are expected to sell such businesses and set up family offices, which will provide IWH with an opportunity to obtain new advisors.
34
Table of Contents
| 8. | Emerging Advisor-Client Relationship Models to Cater to Client Demand. |
Investor demands and regulations are forcing new business models in the wealth management industry that focus on providing better customer experience. Investment advisors must now have multiple investment models to be successful, which typically include: pure automated advisory model, holistic goals-based financial planning and wealth management model, and hybrid advice model.
Opportunity:
The financial services sector represents about 14% of the S&P 500 for a total market capitalization of approximately $2.9 trillion. Currently, the industry faces a confluence of trends supportive of significant opportunity for well-positioned RIAs. These trends include: transition to fiduciary pricing, de-emphasis of national brands, demographic and regulatory changes, and disruptive technologies.
Business Model Shift: In prior decades, brokers were compensated for their investment advice based on a transactional model. Typically a broker would assess a fee for each trade. Accordingly, brokers were incentivized to increase trading frequency instead of providing quality advice. While this model continues to be utilized by the nation’s approximately 1,350 independent broker-dealers, the current trend features a shift towards charging a set percentage fee against AUM. This is considered the fiduciary, or investment advisor model, where client and advisor interests are aligned to increase total wealth.
Although this shift is hardly new, the industry continues to see strong migration among the nation’s approximately 167,000 advisors. Typically, these brokers seek to transition to RIA practices that provide fixed-fee or hybrid business models, and feature similar back-office and regulatory oversight infrastructure they were accustomed to at larger firms. In fact, Cerulli Associates forecasts independent RIAs will control more assets than all brokerage firms by the year 2020.
Traditional Break-Aways: Just as the industry has seen a shift in dominant business models, so too are the power of old brands giving way to emergent innovators providing similar, yet better targeted services for significantly less overhead cost to the advisor. The disruption of traditional media by the internet has materially reduced the power of the familiar old national ‘wire-house’ brands. Supported by superior, more agile technology and far less administrative overhead, newer ‘aggregator’ firms supporting multiple advisors are able to offer much improved advisor economics, driving demand among ‘break-away’ advisor prospects.
To adjust to this market-driven downsizing, many traditional wire-houses are now responding by releasing their smaller advisors. However, the emergent RIA aggregators are situated to profitably service this segment, further accelerating their rise.
Seasoned Advisors Aging-Out: As technology has lured talented, young advisors away from the financial services sector and it has lost an element of prestige since the great recession, studies by Fidelity Clearing suggest that there are now significantly more financial advisors over the age of 70 than there are under 30, with an average advisor age of 51. This demographic trend has several relevant consequences. First, typically younger RIA advisors have superior access to the next generation of wealth as compared to their older broker-dealer counterparts. Second, advisors must clearly establish its succession plan. A well-positioned RIA aggregator should be both culturally appealing and able to offer mentoring to younger advisors, while at the same time have capital available to offer buy-out options to retiring advisors seeking to monetize their practices. Buying out aging advisors may be a fast-track approach to garner profitable assets given the 8,600-plus advisers expected to retire annually well into the next decade. IWH has implemented an internal policy to address any IWA advisors aging out, IWA IARs are required to establish a succession plan for their practice.
35
Table of Contents
Fin-Tech Altering Nature of Advice: ‘Robo-Advisors’, providers of automated investing advice, trading and account maintenance, now represent over $20 billion in assets under management (AUM). While this public-facing technology is the most visible, lesser known but equally disruptive back-office technologies are also making an impact on the industry. These technologies include customer relationship management, document management, trading, billing, reporting, cyber-security and compliance retention software. Access to an integrated, low-cost technology stack is increasingly important to operating a cost-efficient RIA.
As a result of these various converging trends, the market opportunity for well-positioned, growth-oriented RIAs is rising geometrically. Well-rounded skill sets from money management to back-office services and technology, along with access to growth and acquisition capital are critical to participating in this opportunity.
Mergers and acquisitions among RIAs are one indicative measure of this fact, with a 16% compound annual growth rate seen in transaction volume subsequent to the 2008 market crash. In addition, average deal size is growing, now exceeding $1B in assets under management.
IWH is well positioned, structurally and with the organizational team and talent to capitalize on this active merger and acquisition market to expand our platform and consistently acquire a significant position and national market share in advisors, clients and AUM.
Regulatory Environment
The business of three of our subsidiaries, Institute for Wealth Advisor, Inc., Institute for Wealth Consultants, Inc., and Institute for Wealth Management, LLC, is subject to extensive regulation in the United States at the federal level and, to a lesser extent, the state level. Under these laws and regulations, agencies that regulate investment advisers have broad administrative powers, including the power to limit, restrict or prohibit an investment adviser from carrying on its business in the event it fails to comply with applicable laws and regulations. Possible sanctions that may be imposed include the suspension of individual employees, limitations on engaging in certain lines of business for specified periods of time, revocation of investment adviser and other registrations, censures and fines.
The legislative and regulatory environment in which we operate has undergone significant changes in the recent past. New laws or regulations, or changes in the enforcement of existing laws or regulations applicable to us and our subsidiaries’ clients may adversely affect our business. Our ability to function in this environment will depend on our ability to monitor and promptly react to legislative and regulatory changes. There have been a number of highly publicized regulatory inquiries focused on the investment management industry. These inquiries have resulted in increased scrutiny of the industry and new rules and regulations for investment advisers. This regulatory scrutiny may limit our ability to engage in certain activities that might be beneficial to our stockholders.
In addition, as a result of recent market events and certain acts of fraud in the investment management industry, U.S. and non-U.S. governmental and regulatory authorities may increase regulatory oversight of our businesses. We may be adversely affected as a result of new or revised legislation or regulations imposed by the SEC, other U.S. regulatory authorities or self-regulatory organizations that supervise the financial markets. We also may be adversely affected by changes in the interpretation or enforcement of existing laws and rules by these governmental
36
Table of Contents
authorities and self-regulatory organizations, as well as by U.S. courts. It is impossible to determine the extent of the impact of any new laws, regulations or initiatives that may be proposed on us or the markets in which we trade, or whether any of the proposals will become law. Compliance with any new laws or regulations could add to our compliance burden and costs and affect the manner in which we conduct our business.
SEC Regulation
IWA, IWM and IWC are registered with the SEC as investment advisers under the Investment Advisers Act of 1940, as amended (the “Advisers Act”). The Advisers Act, together with applicable SEC’s regulations and interpretations, imposes substantive and material restrictions and requirements on the operations of investment advisers. The SEC is authorized to institute proceedings and impose sanctions for violations of the Advisers Act, ranging from fines and censures to termination of an adviser’s registration.
The Advisers Act imposes substantive regulation on virtually all aspects of our business and relationships with our clients. As registered investment advisers, our subsidiaries are subject to many requirements that cover, among other things, disclosure of information about our business to clients; maintenance of written policies and procedures; maintenance of extensive books and records; restrictions on the types of fees we may charge, including performance fees; solicitation arrangements; engaging in transactions with clients; maintaining an effective compliance program; custody of client assets; client privacy; advertising; and proxy voting. The SEC has authority to inspect any registered investment adviser and typically inspects a registered investment adviser periodically to determine whether the adviser is conducting its activities (i) in accordance with applicable laws, (ii) consistent with disclosures made to clients and (iii) with adequate systems and procedures to ensure compliance.
Our subsidiaries, acting as investment advisers, have fiduciary obligations to their clients. The SEC has interpreted this duty to impose standards, requirements and limitations on, among other things: trading for proprietary, personal and client accounts; allocations of investment opportunities among clients; use of soft dollars; execution of transactions; and recommendations to clients. The failure of IWA, IWM or IWC to comply with the requirements of the Advisers Act, and the regulations and interpretations thereunder, could have a material adverse effect on the Company. Our subsidiaries are subject to regular review by the SEC, and has not had an unresolved customer complaint.
Recent legislation now going into effect, including the revised Department of Labor retirement account standards and Anti-Money Laundering (“AML”) rules are raising the regulatory bar and cost of compliance. As costs and expertise requirements rise, they present an increasing compliance barrier to entry for smaller firms, leaving larger ‘aggregators’ in the best position to spread such costs across their wider base of advisors. Further, in the case of the Department of Labor rules, RIAs are also better positioned relative to broker-dealers, as they already meet the requisite fiduciary standards. Meanwhile, with the SEC increasing its examination rate, the trend of increasing regulation appears likely to continue.
37
Table of Contents
Company Information
Our corporate headquarters are located at Two Galleria Tower 13455 Noel Road, Suite 100 Dallas, Texas 75240, telephone (972) 450-6000. IWM’s headquarters is located at 1776 Lincoln Street, Suite 950 Denver, Colorado 80203.
Our websites are http://iwhinc.com/, http://iwainc.com/ and https://instituteforwealth.com/. We do not incorporate the information on or accessible through our website into this offering circular, and you should not consider any information on, or that can be accessed through, our website a part of this offering circular.
38
Table of Contents
The Company does not own any real estate. We lease two primary locations, our corporate headquarters in Dallas, Texas and our IWM headquarters in Denver, Colorado. Our Dallas office is located at Two Galleria Tower, 13455 Noel Road, Suite 100, Dallas, Texas 75240, and consists of approximately 2,000 square feet. Our Denver office is located at 1776 Lincoln Street, Suite 950 Denver, Colorado 80203, and consists of approximately 3,345 square feet. We currently do not have a policy with respect to investments or interests in real estate, real estate mortgages or securities of, or interests in, persons primarily engaged in real estate activities and generally do not engage in such activities.
39
Table of Contents
MANAGEMENT AND FINANCIAL CONDITION AND RESULTS OF OPERATIONS
Summary
Our company is the result of a successful business combination in 2016 of two companies, the Institute for Wealth Management, LLC (“IWM”), founded in 2003, and Institute for Wealth Holdings, Inc., formerly Cherry, Inc., founded in 2008. We operate a dual investment advisor platform to recruit and train associate investment advisers and investment advisory representatives to gather assets under management under our brand. Among other services, we provide, through our multiple custodians, a single client interface for the administration, execution and reporting for client accounts, and offer advisers online access to fee tracking and payments.
We conduct all of our operations through several subsidiaries. Our primary operating subsidiaries or affiliated entities are:
Institute for Wealth Management, LLC. IWM is our wealth management company which provides over 40 distinct portfolio management strategies or models of separately managed accounts (“SMAs”) held at one or more of IWM’s several custodians. IWM also provides money management services and charges an investment management fee for client accounts, usually as a percentage of their AUM. Fees for total investment advisory services are collected by IWM’s various custodians and remitted to IWM either monthly or quarterly in advance. IWM retains a portion for its investment management services, on average about 50 bps, and remits the balance to IWA as the introducing RIA or, in the case of a third party RIA referring firm, to that RIA.
Institute for Wealth Advisors, Inc. (“IWA”). IWA is our investment advisory representative and advisor service support platform. For the services provided, IWA receives a portion of the total fees charged to clients, which ranges between 1% to 2% annually depending on the size of the client’s AUM. IWA services and collects investment advisory fees, charged to client accounts either monthly or quarterly in advance, as forwarded from IWM, retaining a portion for IWA’s operations and profit margins, and disbursing the balance to our IARs for the net fees they derive from providing investment advisory services to their clients. IWA also provides financial planning for clients of its IARs based on a flat fee for service, usually $1,500 to $5,000 per plan. IWA retains a portion of the planning fee to cover administrative, technology and para planner costs and remits the balance to the IAR.
Institute for Life & Annuity, Inc. (“ILA”). ILA is our affiliated corporate life insurance agency and field marketing organization for approximately 40 life insurance and annuity carriers. IARs that are also licensed insurance agents become appointed with our various carriers through ILA to offer life insurance and annuity policies to their clients. ILA derives a portion of the commissions generated by the producing agents. ILA is owned by Dewey M. Moore, our Chief Executive Officer, and contributes its associated revenue through an expense sharing agreement.
Key Factors Affecting Our Performance
Long-Term Growth in AUM. Our growth strategy is dependent upon enrolling new clients with one or more of our custodians who provide our wealth management, investment advisory and financial planning services. We also plan on expanding our investment management capabilities, enhancing our technology infrastructure, expanding our product offerings, and enhancing customer experience and lifetime value.
40
Table of Contents
We plan to continue to invest significant resources to accomplish these goals, and we anticipate our operating expenses will continue to increase for the foreseeable future, particularly our sales and marketing, technology, and infrastructure expenses. These investments are intended to contribute to our long-term growth, but they may affect our near term profitability.
Recruiting and Maintaining Quality IAR Relationships. Our revenues decreased from 2015 to 2016, but have grown substantially since our merger in 2016. This growth is primarily a result of the addition of new IARs which enhanced the growth of our assets under management. In addition to increasing the number of IARs, this revenue growth was helped by increasing investments from our existing and new IARs and increases in our average customer account size.
We anticipate our future growth will continue to depend in part on attracting new IARs and AUM to our platform. We plan to increase our sales and marketing spending to attract these customers as well as the acquisition of other RIAs and to expand our efforts to recruit IARs. If we are able to invest more in our recruiting and acquisition efforts, we believe we will increase our growth in AUM at a faster rate than in the past, as evidenced by our 2017 results.
Primary Components of Results of Operations
Revenue. We generate the majority of our revenue from (i) investment management fees from client accounts held at our various custodians with which we partner, (ii) investment advisory and financial planning fees paid by clients, and (iii) life insurance and annuity sales and override commission income.
Investment Advisory Compensation Expenses. Our IARs receive compensation based on the amount of fee revenue generated. Our investment advisory compensation expense generally increases in proportion to increases in AUM.
Operating Expenses. Our operating expenses consist primarily of employment and compensation costs, operations and support staff, rent and office maintenance, sales and marketing, technology and software costs and other general and administrative expenses.
Advertising and Marketing Expenses. Our advertising and marketing expenses consist primarily of expenses of recruiting IARs and the engagement of third party broker-dealers and RIAs for enrollment of our wealth management and portfolio strategies and programs. Costs attributable to marketing and distribution of our products includes costs of building general brand awareness, travel and trade show expenses, and salaries and benefits expenses related to our sales and marketing teams.
Other General and Administrative Expenses. Other general and administrative expense consists primarily of salaries and benefits expense for our accounting, legal, and operations teams, and professional services fees.
Results of Operations
We completed our merger with IWM in September 2016 and have operated on a consolidated financial basis since that time. As a result, our consolidated financial statements are only available beginning the fourth quarter of 2016. However, our auditors have prepared consolidated pro forma financial statements for 2015 and 2016, as if the merger had taken place January 1, 2015 and the information presented in this offering circular is presented on such basis.
41
Table of Contents
In the year ending December 31, 2016, we had pro forma revenue of $2,343,745, and operating expenses of $2,917,503, resulting in a net operating loss of $573,758. On a pro forma basis, our 2015 revenue was $3,209,422 and our operating expenses were $3,152,958, resulting in a net operating profit of $56,464.
Comparison of Years Ended December 31, 2016 and 2015
For the years ended December 31, 2016 and 2015, our total revenue was $2,343,745 and $3,209,422, respectively, representing a year-over-year decrease of 27.0%. The decline in revenue was caused by the departure of a number customers of two client RIAs, which began offering their own money management services.
Fees paid to IARs and other direct compensation declined from $1,776,687 to $1,402,440, a decline of 21.1% due to the reduction in average AUM and associated management and advisory fees from the events described above. Gross margin declined in 2016 to $941,305 or 40.2% of revenue from $1,432,736 or 44.6% of revenue in 2015.
Operating expenses increased to $1,515,063 in 2016 compared with $1,376,272 in 2015. Part of the increase was due to expenses associated with our September 2016 merger. In addition, we experienced an increase in wages and benefits expense due largely to building out a sufficient platform to support our operations and growth following the merger.
For the year ending December 31, 2016, we had a net operating loss of $573,758, versus an operating profit of $56,464 for the year ending December 31, 2015.
We recorded non-operating income of $1,714,340, offset by merger expenses of $712,321, interest expense of $290,000 and depreciation & amortization of $8,200 in the year ended December 31, 2016. This resulted in a net profit before taxes of $130,061. For the prior period, we had non-operating income of $226,478, offset by interest expense of $280,493 and depreciation & amortization of $8,645, resulting in a net loss before taxes of $6,196.
Non-operating income in 2016 was primarily due to a gain on debt settlements. As part of the merger, each of IWH and IWM settled certain obligations for less than the amount historically reflected on the balance sheet, resulting in an increase in shareholder equity and a corresponding increase in non-operating income in 2016.
Liquidity and Capital Resources
As of December 31, 2016, we had cash of $37,491. Our primary uses of cash were for IAR and employee compensation, sales and marketing and working capital. Our main source of cash is from investment management and advisory fee revenue and the private debt offering as part of our September 2016 merger. We believe we will require additional cash for our operations in the future in order to fund:
| • | An increase in working capital requirements as we grow, |
| • | Addition of administrative and sales personnel, |
| • | Increases in advertising, public relations and sales promotions as we expand operations, |
| • | Recruiting costs related to adding IARs to our platform, and |
| • | Merger and acquisition activities. |
42
Table of Contents
The following summarizes the key components of our cash flows for the calendar year 2016 compared to 2015, on a pro forma basis:
| 2016 | 2015 | |||||||
| Cash flows used by operating activities |
$ | (1,517,847 | ) | $ | 30,273 | |||
| Cash flows used by investing activities |
(10,000 | ) | 0 | |||||
| Cash flows provided by financing activities |
1,399,543 | 118,499 | ||||||
| Net increase in cash and cash equivalents |
$ | (128,304 | ) | $ | 148,499 | |||
Since inception through September 30, 2017, we have financed our operations primarily through private offerings of debt and our equity securities. We plan to fund our future activities through our existing cash on hand, revenues generated from our operating subsidiaries and affiliates and the capital raised in this offering. The capital raised in this offering, if successful, is expected to fund our growth and acquisition capital needs, and meet our liquidity requirements for the foreseeable future. We believe we have a strong business model and have recently scaled up our expenses to accelerate our growth with the expectation we can raise growth and acquisition capital through the proceeds raised from this offering. We cannot be certain that adequate funding will be available on acceptable terms or available at all. To the extent we raise additional funds by issuing debt or equity securities, our stockholders may experience significant dilution. If we are unable to raise funds when required or on acceptable terms, we may have to significantly scale back our operations to attain a sustainable level of profitability which would be a setback to our business and growth plans. We plan to hold our excess unrestricted cash in short-term interest-bearing money market funds at highly-rated financial institutions.
Subsequent Events:
In the first nine months of 2017, we have increased our AUM from $198.0 million at the end of 2016 to $819.4 million though the combination of acquisitions of books of business from retiring IARs, the affiliation of IARs with our company and the recruitment of new IARs. This growth was funded primarily from the September 2016 private placement of debt and revenues from operations. As of September 30, 2017, we had cash of $6,126. For the nine month period ended September 30, 2017, our cash flow is summarized in the table below:
| 9 Months Ended September 30, 2017 |
||||
| Cash flows used by operating activities |
$ | (112,889 | ) | |
| Cash flows used by investing activities |
0 | |||
| Cash flows provided by financing activities |
$ | 81,524 | ||
| Net increase in cash and cash equivalents |
$ | (31,365 | ) | |
43
Table of Contents
Interim Results
STATEMENTS OF OPERATIONS
FOR THE PERIODS ENDING SEPTEMBER 30, 2016 and 2017
| September 30, 2017 | September 30, 2016 | |||||||
| REVENUE |
||||||||
| Investment Management Revenue |
$ | 3,009,969 | $ | 1,359,294 | ||||
| Other Revenue |
203,658 | 428,871 | ||||||
|
|
|
|
|
|||||
| Total Revenue |
3,213,626 | 1,788,165 | ||||||
| COST OF REVENUE |
||||||||
| Fees Paid to IAR’s |
2,047,310 | 967,058 | ||||||
| Other Cost of Revenue |
128,586 | 82,647 | ||||||
|
|
|
|
|
|||||
| Total Cost of Revenue |
2,175,896 | 1,049,705 | ||||||
|
|
|
|
|
|||||
| Gross Profit |
1,037,730 | 738,460 | ||||||
| OPERATING EXPENSES |
||||||||
| General and Administrative |
97,633 | 97,203 | ||||||
| Salary and Benefits |
915,599 | 690,832 | ||||||
| Rent and Maintenance |
121,240 | 104,426 | ||||||
| Advertising and marketing |
60,621 | 39,897 | ||||||
| Technology and Data Subscriptions |
83,449 | 57,363 | ||||||
| Legal and Professional |
199,497 | 84,547 | ||||||
|
|
|
|
|
|||||
| Total Operating Expenses |
1,478,039 | 1,074,268 | ||||||
|
|
|
|
|
|||||
| Net Operating Income (Loss) |
$ | (440,309 | ) | $ | (335,808 | ) | ||
| NON-OPERATING INCOME |
||||||||
| Other Income |
2 | 1,714,340 | ||||||
| NON-OPERATING EXPENSES |
||||||||
| Depreciation and Amortization |
4,853 | 5,891 | ||||||
| Interest Expense |
149,276 | 243,160 | ||||||
| Merger & Acquisition Expenses |
36,037 | 705,638 | ||||||
|
|
|
|
|
|||||
| Total Non-Operating Expenses |
190,166 | 954,689 | ||||||
|
|
|
|
|
|||||
| Pre Tax Income (Loss) |
$ | (630,472 | ) | $ | 423,844 | |||
| Provision For Income Taxes |
||||||||
|
|
|
|
|
|||||
| NET INCOME (LOSS) |
$ | (630,472 | ) | $ | 423,844 | |||
|
|
|
|
|
|||||
Comparison of Nine-Months Ended September 30, 2016 and 2017
For the nine-months ended September 30, 2017 our revenue increased from $1,788,165 in 2016 to $3,213,626, in 2017, representing a year-over-year increase of 79.7%. The increase in revenue was primarily a result of the recruitment of new IARs and the corresponding growth of AUM to $819.4 million as of September 30, 2017 compared with $195.4 million in the prior period.
Fees paid to IARs and other direct compensation increased from $967,058 to $2,047,310, an increase of 111.7% due to an increase in average AUM and a higher payout percentage on some acquired business. Gross margin increased in the first nine months of 2017 to $1,037,730 or 32.3% of revenue from $738,460 or 41.3% of revenue in the same period of 2016.
44
Table of Contents
Operating expenses increased to $1,478,039 in the first nine months of 2017 compared with $1,074,268 in 2016. We experienced an increase in wages and benefits expense due largely to building out a sufficient platform to support our operations and growth following the merger.
For the period ending September 30, 2017, we had a net operating loss of $440,309, versus an operating loss of $335,808 for the same period a year ago.
In the 2016 period, we recorded non-operating income of $1,714,340, offset by merger expenses of $705,638, interest expense of $243,160 and depreciation & amortization of $5,891, which resulted in a net profit before taxes of $423,844. For the period ended September 30, 2017, we had non-operating income of $2, offset by interest expense of $149,276, merger expenses of $36,037 and depreciation & amortization of $4,853, resulting in a net loss before taxes of $630,472.
Key Operating and Financial Metrics
We regularly review a number of metrics to evaluate our business, measure our performance, identify trends, formulate financial projections and make strategic decisions. The table below shows our year-end AUM and our review of our components of revenue and detail of our expenses and gross profits as a percentage of management fee revenue and/or total revenue. The table below is on a pro-forma consolidated basis, as if the merger had been completed on January 1, 2015.
45
Table of Contents
| December 31, 2016 |
% Revenue |
December 31, 2015 |
% Revenue |
% Change |
||||||||||||||||
| Assets Under Management |
$ | 198,000,884 | $ | 198,079,225 | (0.0 | )% | ||||||||||||||
| Year Ended December 31, | 2016 | 2015 | ||||||||||||||||||
| Investment Management |
$ | 221,487 | 9.5 | % | $ | 329,919 | 10.3 | % | (32.9 | )% | ||||||||||
| Investment Advisory |
$ | 1,925,215 | 82.1 | % | $ | 2,536,772 | 79.0 | % | (24.1 | )% | ||||||||||
| Subadvisory |
$ | 80,241 | 3.4 | % | $ | 119,916 | 3.7 | % | (33.1 | )% | ||||||||||
| 401(k) Advisory |
$ | 9,523 | 0.4 | % | $ | 11,388 | 0.4 | % | (16.4 | )% | ||||||||||
| Life & Annuity Commissions |
$ | 92,376 | 3.9 | % | $ | 198,605 | 6.2 | % | (53.5 | )% | ||||||||||
| Financial Planning Revenue |
$ | 14,903 | 0.6 | % | $ | 12,822 | 0.4 | % | 16.2 | % | ||||||||||
| % Advisory Fees of AUM (Ending) |
1.13 | % | 1.51 | % | ||||||||||||||||
| Total Revenue |
$ | 2,343,745 | 100.0 | % | $ | 3,209,422 | 100.0 | % | (27.0 | )% | ||||||||||
| % of AUM |
1.18 | % | 1.62 | % | ||||||||||||||||
| COST OF REVENUE |
||||||||||||||||||||
| Fees Paid to IAR’s |
$ | 1,254,657 | 53.5 | % | $ | 1,616,551 | 50.4 | % | (22.4 | )% | ||||||||||
| Fees Paid to Third Party Firms |
$ | 47,903 | 2.0 | % | $ | 33,046 | 1.0 | % | 45.0 | % | ||||||||||
| Commissions to Agents |
$ | 99,880 | 4.3 | % | $ | 127,089 | 4.0 | % | (21.4 | )% | ||||||||||
|
|
|
|
|
|||||||||||||||||
| Total Cost of Revenues |
$ | 1,402,440 | $ | 1,776,686 | (21.1 | )% | ||||||||||||||
| % of Revenue |
59.8 | % | 55.4 | % | ||||||||||||||||
| GROSS PROFIT |
||||||||||||||||||||
| Gross Profit Advisors Fees |
$ | 933,907 | 39.8 | % | $ | 1,348,398 | 42.0 | % | (30.7 | )% | ||||||||||
| Gross Profit Life & Annuity Fees |
$ | (7,504 | ) | -0.3 | % | $ | 71,516 | 2.2 | % | (110.5 | )% | |||||||||
| Gross Profit Advisor Services |
$ | 14,903 | 0.6 | % | $ | 12,822 | 0.4 | % | 16.2 | % | ||||||||||
|
|
|
|
|
|||||||||||||||||
| Total Gross Profit |
$ | 941,305 | $ | 1,432,736 | (34.3 | )% | ||||||||||||||
| % of Revenue |
40.2 | % | 44.6 | % | ||||||||||||||||
| OPERATING EXPENSES |
||||||||||||||||||||
| General and Administrative |
143,277 | 6.1 | % | 135,020 | 4.2 | % | 6.1 | % | ||||||||||||
| Salary and Benefits |
922,190 | 39.3 | % | 829,496 | 25.8 | % | 11.2 | % | ||||||||||||
| Rent and Maintenance |
139,582 | 6.0 | % | 138,677 | 4.3 | % | 0.7 | % | ||||||||||||
| Advertising and marketing |
101,207 | 4.3 | % | 109,496 | 3.4 | % | (7.6 | )% | ||||||||||||
| Technology and Data Subscriptions |
87,850 | 3.7 | % | 64,018 | 2.0 | % | 37.2 | % | ||||||||||||
| Legal and Professional |
120,957 | 5.2 | % | 99,565 | 3.1 | % | 21.5 | % | ||||||||||||
|
|
|
|
|
|||||||||||||||||
| Total Operating Expenses |
$ | 1,515,063 | $ | 1,376,272 | 10.1 | % | ||||||||||||||
| % of Revenue |
64.6 | % | 42.9 | % | ||||||||||||||||
46
Table of Contents
DIRECTORS, OFFICERS AND SIGNIFICANT EMPLOYEES
The following table sets the name, position, age, term in office and, for part time employees, approximate hours per week, for our executive officers, directors’ and significant employees’. Each director is elected by the shareholders and holds such office until his successor is duly elected and qualified. The executive officers are chosen by the directors and can be removed by the directors with or without cause at any time by an affirmative vote by the majority of the directors.
| Position |
Age | Term in Office | Approximate hours per week for part- time employees |
|||||||||||
| Executive Officer: |
||||||||||||||
| Dewey M. “Rusty” Moore, Jr.* |
Chief Executive Officer/President/Director | 68 | September 2008 - Present | N/A | ||||||||||
| Matthew Medeiros |
Executive Vice President/Secretary/Chief Investment Officer/Director | 53 | September 2016 - Present | N/A | ||||||||||
| Don Schulz |
Chief Financial Officer | 55 | September 2016 - Present | N/A | ||||||||||
| Director: |
||||||||||||||
| Lloyd E. Allen |
Vice Chairman of Board of Directors | 74 | August 2009 - Present | N/A | ||||||||||
| J. Timothy Brittan |
Director | 63 | September 2016 - Present | N/A | ||||||||||
| Significant Employees: |
||||||||||||||
| John H. Moore, III* |
Managing Director for Business Development | 46 | October 2016 - Present | N/A | ||||||||||
| Jeff Jorgensen |
Chief Operating Officer of IWM | 48 | January 2010 - Present | N/A | ||||||||||
| Jeff Pietsch |
Head of Capital Markets for IWM | 49 | June 2017 - Present | N/A | ||||||||||
| * | Rusty Moore and John Moore are cousins. |
Leadership Team
Dewey M. “Rusty” Moore, Jr. – Chairman, President & CEO, Director
Rusty Moore is the co-founder of IWH (formerly Cherry, Inc.), which was formed in 2008 as a holding company for its related financial and investment advisory platform. Mr. Moore serves as our Chairman of the Board, President and CEO and is also President of IWA and the Chief Compliance Officer for IWA and IWC. From September 2006 to March 2008, Mr. Moore served as a director of Puritan Financial Companies, Inc., where he was the CEO of Puritan Investment Advisors, Inc., and was also chairman of the board and president of Puritan Life Insurance Co.
47
Table of Contents
Mr. Moore served as Chairman and CEO of Rushmore Financial Group, Inc., a financial services group of companies which he founded in 1991. Under his leadership, the company grew rapidly from a startup to a retail brokerage organization with a nationwide account base and a network of more than 2,000 agents and registered representatives. During his 15-year tenure with Rushmore, Mr. Moore took the company public in April 1998 and guided the company through a number of public and private-equity transactions, culminating with the merger and acquisition of Terra Nova Trading, L.L.C. in May 2006, after which he retired from the company. Rushmore/Terra Nova was subsequently taken private, being acquired by Lightspeed Technologies of New York.
Mr. Moore earned a BBA from Southern Methodist University and currently holds FINRA Series 6, 23, 24, 26, 62, 63, 65 and 79 Securities Registrations and is a registered investment advisor. He also holds a Certificate of Completion for the Program in Financial Planning from Southern Methodist University as a candidate for the CFP® certification and is a Certified Estate Planner, CEP®. Mr. Moore has previously served on the boards of directors of Rushmore Financial Group, Inc., a NASDAQ listed company, two life insurance companies, several private companies and a not-for-profit international ministry organization, MentorLink International, where he also served on the audit and development committees. He is a frequent speaker to business, community and church groups and is a past member of the National Association of Corporate Directors.
Matthew D. Medeiros – President and Chief Executive Officer of IWM, Executive Vice President and Director
Matthew Medeiros is the founder, President and Chief Executive Officer of IWM, the company he founded in Denver, Colorado in 2003, and currently serves as a member of our Board of Directors, Executive Committee, Capital Markets Team and as our Executive Vice President and Secretary. Prior to founding IWM, Mr. Medeiros was the chief executive officer at The Peak Companies from 1995 until 2003.
Mr. Medeiros has been cited in articles appearing in the Wall Street Journal, Investment News, Wall Street Wire in addition to television appearances on CBS News and CW2 News. He is a frequent guest lecturer at universities, academic and professional associations, trade organizations and business groups.
Mr. Medeiros’ career in the investment industry began and expanded beyond the United States. In conjunction with his seven year career in professional baseball in Europe and his interest in the financial markets, he helped create a multi-national European-based financial services organization that was also one of the few civilian businesses permitted on European U.S. Military bases to assist U.S. soldiers in their financial needs. During this period, he was often a guest speaker at the University of Chicago and University of Maryland business classes.
Mr. Medeiros’ prior community involvement has included serving as board chair for Community in Schools, one of Colorado’s largest high school dropout prevention programs, and as a board member of the Colorado Arts Foundation. Mr. Medeiros earned his Bachelor of Science in finance from LaSalle University and has passed the Series 6, 7 and 63 securities examinations.
Donald Schulz, Jr. – Chief Financial Officer
Don Schulz, CPA serves as our Chief Financial Officer, joining us in 2016 after taking a year-long sabbatical. Mr. Schulz is a Certified Public Accountant in the state of Colorado with over 30 years of experience in accounting and financial management. Mr. Schulz has extensive experience working with private equity backed companies ranging from start-ups to mid-cap size companies.
48
Table of Contents
From November 2012 to August 2015, Mr. Schulz served as Director of Finance, Compliance and Tax/Controller in a consulting capacity for Westmount Realty Capital, LLC, a national real estate company. His prior experience included serving as chief financial officer, controller and as a consultant for New Core Technology Partners, LLC, a zero revenue start-up wine industry service company. Prior to that, Mr. Schulz served in various financial positions with Pluris Holding Company, Stockdale Investments, Inc. and Earth Green Products, Inc., companies ranging from $3 million to $80 million in annual revenue.
Mr. Schulz earned a Bachelor of Science degree in Business Administration and Accounting from the University of South Dakota.
Lloyd. E. Allen, Jr. – Rear Admiral, U.S. Navy, (Ret.) Vice Chairman of the Board of Directors
Admiral Allen has served as a member of the IWH board of directors since August 2009. His military service career spanned 30 years in the U.S. Navy where he led six operational commands: an F-14 Squadron, a Carrier Air Wing Commander, an Amphibious Assault ship, an Attack Aircraft Carrier (The USS Coral Sea), Naval Space Command and a Carrier Battle Group Commander/NATO Strike Force. He also served as Joint Task force Commander at sea and Deputy Joint Task Force Commander in Southwest Asia. He also served with the Joint Chiefs of Staff at the Pentagon. He was awarded the Tail hooker of the Year Award and the United States Navy League John Paul Jones Award for Inspirational Leadership.
After retiring from the Navy, from May 1996 to May 2007 Admiral Allen served as Vice President Business Development for Oracle Corporation, where he focused on e-Business solutions for Department of Defense agencies, the U.S. Navy and Marine Corps and the public sector health industry. He was also responsible for Oracle’s Leadership Development and Executive Coaching initiatives. Since 2000, Admiral Allen has been a business and leadership coach with the Executive Success Group. In addition to his roles and responsibilities as Vice Chairman of our Board of Directors, Admiral Allen also serves as an executive coach and leadership development resource for our Executive Management Team.
Admiral Allen received his undergraduate degree from the University of Texas at Austin and holds a Master’s Degree in International Relations and Business. He graduated from the National War College, and completed graduate business studies in Information Technologies.
J. Timothy Brittan – Member of the Board of Directors
Mr. Brittan has served as a member of our Board of Directors since September 2016. Mr. Brittan is President of Infinity Oil & Gas, Inc., based in Denver, an industry leader in the shale revolution in United States. Mr. Brittan is also the Vice Chairman of Indigena Capital, a new initiative with American Indian Tribal Nations.
Mr. Brittan is also a three-term City Councilman for Westlake, Texas where he also serves as the Chairman of the Planning & Zoning Commission. He has served on the boards of several public and private oil companies as well as audit and compensation committees for certain of these companies. Mr. Brittan earned his Engineering Degree from the Colorado School of Mines and he also completed graduate studies at the University of Colorado.
49
Table of Contents
Significant Employees and Executives of Subsidiaries
Jeff Jorgensen – Chief Operating Officer of IWM
Jeff Jorgensen joined IWM in September 2007 and currently serves as the Chief Operating Officer for IWM, a position he has held since January 2010. Prior to becoming Chief Operating Officer for IWM, Mr. Jorgensen was the Vice President of Operations for IWM.
Prior to joining IWM, Mr. Jorgensen worked for Columbia Funds from October 2004 to August 2007 where he assisted advisors and clients with back office support and corporate training. Formerly, Jeff was a life insurance agent for New York Life Insurance Company.
Mr. Jorgensen earned his BA Degree in Business Administration with an emphasis in Entrepreneurial Management and a Minor in Accounting from Western Washington University.
John H. Moore, III – Managing Director of Corporate Development
Mr. Moore joined IWA in October 2016 as an IAR. Early in 2017 his role was expanded to Managing Director for Business Development for IWH and as a Regional Vice President for IWA, where he leads the recruitment process for individual advisors, teams and full-service RIAs and is involved in sourcing deals, transactions and other joint ventures and partnerships for the Company.
Prior to joining IWA, Mr. Moore served as a financial advisor at Wells Fargo Advisors from November, 2014 to August 2016. Prior to Wells Fargo, he was a financial advisor at UBS Financial Services from April 2008 to November 2014 and as a financial advisor with at Morgan Stanley from 2003 to 2008. His experience included managing high net worth and middle-market relationships, including hedge funds and family offices.
Mr. Moore also previously served as a senior consultant for five years at Ernst & Young in Dallas and San Francisco. Mr. Moore earned his BBA in Accounting from the University of Texas at Arlington.
Jeff Pietsch – Senior Portfolio Manager, Head of Capital Markets of IWM
Jeff Pietsch, JD, CFA, joined IWM in June 2017, heads up the Capital Markets Team and serves on IWM’s Investment Committee. He is a Registered Investment Adviser Representative in the State of Washington who has worked in the active and alternative investment industry since 2001. Since December 2011, he has been the Managing Director of Eastsound Capital Advisors, LLC (ECA). ECA is a specialty RIA owned by Mr. Pietsch that does not compete with, and is not in conflict with IWM or IWA. Prior to forming ECA, he managed his own private investment fund and authored a popular financial education newsletter. Mr. Pietsch serves as Head of Capital Markets for IWM as a contract consultant.
Previously, Mr. Pietsch served as President and Head of Investments for Concert Wealth Management, Inc., a registered investment advisor from October 2013 to March 2017, Executive Manager of Purcell Advisory Services, LLC, a tactical manager of managers advisor as a contract consultant from May 2012 to August 2013, CEO of Typenex Medical, LLC, a venture-backed hospital products company, Senior Investment Associate for Chicago Venture Partners, LLC, a private-equity fund, Principal at RE2 Market & Economic Advisors, a real estate consulting firm, and COO of Attractions Hawaii, high-end themed attractions partnership. Mr. Pietsch began his career in Honolulu as a Management Consultant for KPMG Peat Marwick.
50
Table of Contents
Mr. Pietsch has been a Chartered Financial Analyst since 2002. He received a Bachelor of Science degree from Cornell University, his MBA in finance from Northwestern University, Kellogg School of Management, and a Juris Doctorate degree from the Northwestern University School of Law.
Creg Shaffer – Chief Economist, Investment Committee Member of IWM, Investment Advisor
Creg Shaffer has served on IWM’s Investment Committee as Chief Economist since his transition to the Company in late 2016. Creg is also a registered investment advisor based in Reno, Nevada. In his dual roles with IWM, he applies macro-economic theory and trends to market behaviors at the asset class level in the design and implementation of practical, actively-managed investment portfolios.
Creg served as an investment advisor and as a member of the Investment Advisory Committee as Chief Economist from 2013 through 2016 with Concert Capital Management. Mr. Shaffer obtained his investment advisor registration when he assumed the Managing Partner responsibilities at a boutique investment consulting company in 2008.
Mr. Shaffer previously served as a financial systems developer for multiple corporate clients from 2003 to 2009 and as a Senior Manager at Deloitte & Touche from 1998 to 2003. Prior to his time at Deloitte, Mr. Shaffer worked as Manager, Planning & Control for the Federal Reserve Bank of Minneapolis, and Research Economist for the Federal Reserve Bank of Kansas City.
Mr. Shaffer earned a Bachelor of Science degree in Economics from Idaho State University and a Master’s Degree in Economics from Iowa State University.
Thomas Scott Brooks – Compliance Consultant for IWA and IWC
Scott Brooks has served IWA and IWC as a Compliance Consultant since 2013. He most recently served as President and Chief Compliance Officer with Puritan Brokerage Services, Inc., a FINRA broker/dealer and Puritan Investment Advisors, Inc. both of which he help establish as a subsidiaries of Puritan Financial Companies, Inc. from their inception in 2007 through October 2013.
Scott formerly served as President of RushTrade Securities, Inc., a division of RFGI under the direction of Mr. Moore as CEO. He joined RushTrade in November of 2004 and served as President and Chief Compliance Officer until late 2006. His duties included overseeing advertising, new accounts, client services, software trading systems and compliance for RushTrade Securities, a national direct access, online brokerage firm.
Scott has over 22 years of experience in the securities industry. He previously served as President of Online Securities, Inc., with operations in both Europe and the U.S. Prior to Online Securities, he served as President of Brokerage Services for Momentum Securities, Inc. Mr. Brooks’ earlier career included positions in the Securities Trading with Goldman Sachs, Texas First Brokerage, and Kemper Securities.
51
Table of Contents
COMPENSATION OF DIRECTORS AND EXECUTIVE OFFICERS
We compensate our employees fairly and in alignment with industry standards. There are no salaries paid to any director. Independent directors (currently J. Timothy Brittan and Lloyd E. Allen, Jr.) are paid $1,000 per in person board meeting and $250 per telephonic meeting. Only Mr. Moore and Mr. Medeiros have employment agreements, the remaining members of the management team are independent contractors or at-will employees. The below chart summarizes the compensation of the three most highly paid directors or executive officers at the Company.
| Name: |
Positions at Company |
Cash Compensation |
Other Compensation |
Total Compensation |
||||||||||
| Compensation for 2017 |
||||||||||||||
| D.M. “Rusty” Moore, Jr. |
Chief Executive Officer/President/Director | $ | 347,565 | $ | 0 | $ | 347,565 | 1 | ||||||
| Matthew Medeiros |
Executive Vice President/Secretary/Chief Investment Officer/Director | $ | 320,000 | $ | 0 | $ | 320,000 | 2 | ||||||
| Don Schulz |
Chief Financial Officer | $ | 52,278 | $ | 0 | $ | 52,278 | |||||||
| J. Timothy Brittan |
Independent Director | $ | 1,000 | $ | 0 | 3 | $ | 1,000 | ||||||
| Lloyd E. Allen, Jr. |
Independent Director | $ | 1,000 | $ | 0 | 3 | $ | 1,000 | ||||||
1. Mr. Moore’s employment agreement provides for an annual base salary of $250,000, plus certain commissions, overrides and renewal payments totaling $97,565 in 2017. Mr. Moore voluntarily deferred $261,444 in compensation in 2017. Mr. Moore did not receive any incentive bonus compensation in 2017.
2. Mr. Medeiros’ employment agreement provides for an annual base salary of $320,000. Mr. Medeiros voluntarily deferred $154,791 in compensation in 2017. Mr. Medeiros did not receive any incentive bonus compensation in 2017.
3. The Board of Directors previously determined that independent members of the Board of Directors would receive 10,000 shares of Common Stock annually, but in 2017 the Company determined to not issue any Common Stock to the independent members of the Board of Directors for 2017 and the Company is under no obligation to issue such shares for 2017.
DIRECTOR COMPENSATION
There are no salaries paid to any director, except for the salaries paid to Mr. Moore and Mr. Medeiros for their roles as officers. Independent directors (currently J. Timothy Brittan and Lloyd E. Allen, Jr.) are paid $1,000 per in person board meeting and $250 per telephonic meeting. In 2016, the Board of Directors voted that each independent director would receive 10,000 shares of Common Stock annually, but in 2017 the Company determined to not issue any Common Stock to the independent members of the Board of Directors for 2017. Our directors are elected for three-year terms. Advance notice of stockholder nominations for the election of directors shall be at least ninety (90) days in advance of the date in which the next annual meeting of stockholders is held. In addition, directors may be removed “only for cause” as defined in our Certificate of Incorporation, and such certificate require an action by at least two-thirds of the voting power of all of the shares of the Company entitled to vote generally in the election of directors, voting together as a single class.
EMPLOYMENT AGREEMENTS
Dewey “Rusty” Moore, Jr.
We executed an employment agreement with Mr. Moore on September 23, 2008. The initial term of his agreement expired on September 23, 2011, but is automatically renewed each year, unless either party gives one hundred and twenty (120) days’ prior written notice. Mr. Moore is entitled to a base salary of $250,000 per annum plus an incentive bonus and any commissions or overrides from fees or commissions generated by associates under his direction or authority. The Board of Directors has not adopted an incentive bonus plan and any incentive compensation which may be paid is at the discretion of the Board of Directors, including the independent members of the Board. We may terminate Mr. Moore’s employment at any time; however, if he is terminated without cause then he will be entitled to receive any compensation through the date of termination, an amount equal to his base salary for the remainder of the term of his agreement, any vested commissions and any incentive bonus that would otherwise be due and payable. Mr. Moore is restricted from competing with us or soliciting any of its current or former employees for two years following his employment with us.
52
Table of Contents
Matthew D. Medeiros
Mr. Medeiros, the Company and IWM executed an employment agreement on September 12, 2016. The initial term of his agreement expires on September 12, 2019 and will automatically renew each year, unless either the Company and IWM on the one hand or Mr. Medeiros on the other hand gives one hundred and twenty (120) days’ prior written notice. Mr. Medeiros is entitled to a base salary of $320,000 per annum plus stock options and an incentive bonus. The Board of Directors has not adopted an incentive bonus plan and any incentive compensation which may be paid is at the discretion of the Board of Directors, including the independent members of the Board. We may terminate Mr. Medeiros’ employment at any time; however, if he is terminated without cause then he will be entitled to receive any compensation through the date of termination, an amount equal to his base salary for the remainder of the term of his agreement and any incentive bonus that would otherwise be due and payable. Mr. Medeiros is restricted from competing with us or soliciting any of its current or former employees for two years following his employment with us.
53
Table of Contents
SECURITY OWNERSHIP OF MANAGEMENT AND CERTAIN SECURITYHOLDERS
| Class of Equity |
Name and address |
Amount and nature of ownership |
Amount and nature of acquirable ownership |
Percent of Class |
||||||||
| Individual Directors and Officers: |
| |||||||||||
| Common Stock |
Matthew D. Medeiros* | 200,163 shares | 1,281,040 | 1 | 30.60 | % | ||||||
| Common Stock |
D.M. “Rusty” Moore, Jr.+ | 699,500 shares | 110,737 | 2 | 16.48 | % | ||||||
| Common Stock |
Lloyd E. Allen, Jr. + | 257,500 shares | 51,518 | 3 | 6.33 | % | ||||||
| Common Stock |
Jeff Jorgensen* | 40,033 shares | 0 | 0.82 | % | |||||||
| Common Stock |
Timothy Brittan | 0 shares | 25,000 | 4 | 0.51 | % | ||||||
| All Directors and Officers: |
| |||||||||||
| Common Stock |
Directors and Officers* | 1,197,196 shares | 1,468,295 | 54.10 | % | |||||||
| Shareholders: |
| |||||||||||
| Common Stock |
Michael and Ann Dugan* | 0 shares | 343,136 | 7.04 | %5 | |||||||
| Common Stock |
Richard Parker+ | 312,500 shares | 0 | 6.41 | %6 | |||||||
| + | Two Galleria Tower, 13455 Noel Road, Suite 100 Dallas, Texas 75240 |
| * | 1776 Lincoln St., Suite 950, Denver Colorado 80203 |
| 1 | This represents Mr. Medeiros’ ownership of Series C Convertible Preferred Stock, which is convertible into one share of Common Stock and votes on an as converted basis with Common Stock. Mr. Medeiros holds 400,325 shares of Series C Convertible Preferred Stock through KM Investment Trust. |
| 2 | This amount represents 66,987 shares of Series D Convertible Preferred Stock, each share is convertible into one share of Common Stock, and 43,750 shares of Common Stock acquirable by exercising warrants. |
| 3 | This amount represents 41,338 shares of Series D Convertible Preferred Stock, each share is convertible into one share of Common Stock, and 10,180 shares of Common Stock acquirable by exercising warrants. |
| 4 | This amount represents 25,000 shares of Series D Convertible Preferred Stock, each share is convertible into one share of Common Stock. |
| 5 | This amount represents 343,136 shares of Series C Convertible Preferred Stock, each share of which is convertible into one share of Common Stock and votes with the Common Stock on an as converted basis. Michael and Ann Dugan do not own in excess of 10% of voting stock, because Series D Convertible Preferred Stock and Series C Convertible Preferred Stock vote as a class with Common Stock; however, they own 18.02% of outstanding Series C Convertible Preferred Stock. Mr. and Ms. Dugan have exercised their rights pursuant to a Put Call Agreement that requires the Company to purchase all outstanding Series C Convertible Preferred Stock held by them by April 18, 2018. |
| 6 | Richard Parker does not own in excess of 10% of voting stock, because Series D Convertible Preferred Stock and Series C Convertible Preferred Stock vote as a class with Common Stock; however, he does beneficially own 11.57% of all outstanding Common Stock. |
54
Table of Contents
Merger with Institute for Wealth Management Holdings, Inc.
On September 12, 2016, the Company’s former subsidiary, Cherry Acquisitions, Inc., a Delaware corporation (“Cherry”) merged with Institute for Wealth Management Holdings, Inc., a Delaware corporation (“IWMH”), the parent company of IWM. IWMH was the surviving company post-closing, and has subsequently transferred all of the outstanding membership interest in IWM to IWH. In exchange for the Merger, IWMH shareholders surrendered all of their ownership interest in IWMH and were issued forty-seven percent (47%) of the outstanding stock of the Company on a fully-diluted basis.
Mr. Medeiros was an executive officer of IWMH prior to the merger and J. Timothy Brittan was a director of IWMH. Pursuant to the merger, Mr. Medeiros and Mr. Brittan were nominated to the Board of Directors of the Company and subsequently voted onto the Board of Directors. Subsequent to the transaction, Mr. Medeiros was appointed as the Executive Vice President of the Company and joined the Company’s Executive Committee along with Dewey M. Moore.
In exchange for all of his ownership in IWMH, Mr. Medeiros received 1,281,040 shares of Series C Convertible Preferred Stock, which is held by him individually and as a trustee of KM Investment Trust, and 200,163 shares of Common Stock. Mr. Medeiros also agreed to release and waive, pursuant to that certain Release and Waiver of Compensation Claims dated September 12, 2016, all claims to $886,067 worth of accrued compensation.
Exchanges.
Dewey “Rusty” Moore exchanged all of his outstanding Senior Secured Notes and converted all of his outstanding Series B Convertible Preferred Stock (including all accrued but unpaid dividends) for 66,987 shares of Series D Convertible Preferred Stock.
Lloyd Allen exchanged outstanding Senior Secured Notes and converted outstanding Series B Convertible Preferred Stock (including all accrued but unpaid dividends) for 41,338 shares of Series D Convertible Preferred Stock.
Tim Britton exchanged outstanding debt for 25,000 shares of Series D Convertible Preferred Stock.
Put Call Agreement.
In connection with the 2016 merger, the Company entered into a Put Call Agreement with a holder of approximately 18% of the outstanding Series C Convertible Preferred Stock, or 7.04% of Common Stock on an as converted basis. However, this holder does not hold greater than 10% of our total outstanding voting securities. Pursuant to this Put Call Agreement, the shareholder held the option to require the Company to purchase all, but not less than all, of its Series C Convertible Preferred Stock for $350,000. On December 18, 2017, the Company received a notice of exercise from the shareholder under the Put Call Agreement which would require the Company to purchase the shares of Series C Convertible Preferred Stock. The Company and the shareholder subsequently entered into an amendment to this Put Call Agreement which extended the deadline for the Company to purchase all of such shares of Series C Convertible Preferred Stock to April 18, 2018. The Company expects to explore potential alternatives to purchasing such shares with the shareholder.
Potential Interested Transaction.
The Company has considered and will consider acquiring the ILA from Dewey M. Moore, Jr. Any transaction will be conducted on an arms-length basis for a price determined by an independent third-party evaluation and must be unanimously approved by the independent members of the Board of Directors.
55
Table of Contents
The following summary is a description of the material terms of our capital stock and is not complete. For more detailed information, you should refer to our certificate of incorporation, as amended, and our bylaws, which have been filed with the Securities and Exchange Commission as part of this offering circular.
Overview
Our authorized capital stock consists of 50,000,00 shares of Common Stock, par value $0.001 (“Common Stock”) and 10,000,000 shares of Preferred Stock, par value of $0.001 (“Preferred Stock”). The Preferred Stock currently consists of 70,000 authorized shares of Series B Convertible Preferred Stock, 1,925,000 authorized shares of Series C Convertible Preferred Stock and 2,500,000 authorized shares of Series D Convertible Preferred Stock. The Series C Convertible Preferred Stock currently pays no dividend. We previously issued a class of Series A preferred stock, which has been redeemed and may not be reissued. As a result, 5,500,000 shares of Preferred Stock remain undesignated. These undesignated shares of Preferred Stock may be issued from time to time in one or more series pursuant to a resolution or resolutions providing for such issue duly adopted by the Board of Directors. The Board is further authorized, subject to limitations prescribed by law, to fix by resolution or resolutions the designations, powers, preferences and rights, and the qualifications, limitations or restrictions thereof, of any wholly unissued series of Preferred Stock, including without limitation authority to fix by resolution or resolutions the dividend rights, dividend rate, conversion rights, voting rights, rights and terms of redemption (including sinking fund provisions), redemption price or prices, and liquidation preferences of any such series, and the number of shares constituting any such series and the designation thereof, or any of the foregoing.
Offered Securities
We are offering shares of our Series D Convertible Preferred Stock to investors in this offering. The Series D Convertible Preferred Stock may be converted into shares of our Common Stock at the discretion of each investor. As such, we are qualifying up to 2,000,000 shares of Series D Convertible Preferred Stock and up to 2,000,000 shares of Common Stock under this offering statement, of which this offering circular is a part.
The following description summaries important terms of our capital stock. This summary does not purport to be complete and is qualified by the provisions of our organizational documents, copies of which have been filed as exhibits to this offering statement.
Series D Convertible Preferred Stock.
We have authorized 2,500,000 shares of Series D Preferred Stock (“Series D Stock”), par value of $0.001, of which 267,300 shares are outstanding as of the beginning of this offering. Series D Stock ranks, with respect to dividends, redemption, liquidation, dissolution and winding up, on par with the Series B Convertible Preferred Stock (“Series B Stock”) and the Series C Convertible Preferred Stock (“Series C Stock”). Series D Stock has a cumulative dividend rate of 7% per annum, accruing quarterly, payable as declared by our Board of Directors. On matters presented to our stockholders each holder of Series D Stock is entitled to one vote per share of Series D Stock. Additionally, the affirmative vote of a majority of the outstanding Series D Stock is needed to (i) amend any right applicable to Series D Stock, or any provision of the Certificate of Incorporation that adversely affects Series D Stock, (ii) create a class of stock, unless such stock ranks junior to Series D Stock with respect to dividends and liquidation, or (iii) issue or obligate the Company to issue any additional shares of Series D Stock, Series B Stock or Series C
56
Table of Contents
Stock. Each share of Series D Stock is convertible into one share of Common Stock at a conversion price of $10.00 per share at the election of the holder. In the event of a liquidation, Series D Stock is entitled to an amount equal to 1.65x of the original issue price, plus any accumulated but unpaid dividends. Series D Stock can be redeemed, in our discretion at any time, for an amount equal to 1.65x of the original issue price, plus any accumulated but unpaid dividends and may not be reissued after redemption. The foregoing is a brief description of certain terms of Series D Stock and are subject to the specific terms and rights as provided for in the Certificate of Designation attached to this offering circular.
Common Stock
Holders of Common Stock are entitled to one vote for each share held of record on all matters to be voted on by the shareholders. There is no cumulative voting with respect to the election of directors, with the result that the holders of more than fifty percent of the shares voted for the election of directors can elect all of the members of the Board of Directors. The holders of Common Stock are entitled to receive dividends when, as and if declared by the Board of Directors out of funds legally available therefore, subject to the rights of outstanding Preferred Stock. In the event of the Company’s liquidation, dissolution, or winding up, the holders of Common Stock are entitled to share ratably in all assets remaining available for distribution to them after payment of liabilities and after provision has been made for each class of stock, if any, having preference over the common stock. Holders of Common Stock do not have preemptive rights.
Other Securities
Series B Convertible Preferred Stock.
We authorized 70,000 shares of Series B Stock, par value of $0.001, of which 42,750 shares are currently outstanding. Series B Stock ranks on par with Series D Stock and Series C Stock with respect to dividends, redemption, liquidation, dissolution and winding up. Series B Stock has a cumulative dividend rate of 7% per annum, accruing quarterly, payable as declared by the Company’s Board of Directors. The dividend rate payable on the Series B Stock is indexed to the Consumer Price Index if such index is 7% or greater. The Series B Stock does not have the right to vote, except for (i) an amendment to any right applicable to Series B Stock or provisions to the Certificate of Incorporation that adversely affects Series B Stock, (ii) the creation of a class of stock, unless such stock ranks junior to Series B Stock with respect to dividends and liquidation preference, or (iii) the issuance or obligation to issue additional Series B or Series C Stock. In the event of a liquidation, holders of Series B Stock are entitled to the greater of $10 per share plus any accumulated but unpaid dividends or the amount such share would have been entitled to had it been converted into Common Stock. Each share of Series B Stock is convertible into four shares of Common Stock at a conversion price of $2.50 per share at the election of the holder. Series B Stock can be redeemed for $10 per share plus any accumulated but unpaid dividends and may not be reissued after redemption. The Company must redeem the outstanding shares of Series B Stock in the event of a “deemed liquidation event” as defined under the terms of the Series B Stock certificate of designation.
Series C Convertible Preferred Stock.
We authorized 1,925,000 shares of Series C Stock, par value of $0.001, of which 1,904,404 shares are currently outstanding. The Series C Stock currently pays no dividends. Holders of Series C Stock vote as a class with Series D Stock and the Common Stock on an as converted basis. An affirmative vote of the majority of the Series C Stock is needed to (i) amend any right applicable to Series C Stock or any provision of the Certificate of Incorporation that adversely affects Series C Stock, (ii) create a class of stock, unless such stock ranks junior to Series C Stock with respect to dividends and liquidation, or (iii) issue or obligate the Company to issue any additional shares of Series D Stock, Series B Stock or Series C
57
Table of Contents
Stock. In the event of a liquidation, holders of Series C Stock are entitled to the greater of $1.2489 per share plus any accumulated but unpaid dividends or the amount such share would have been entitled to had it been converted into Common Stock. Holders of Series C Stock may elect to convert their shares into shares of Common Stock. In addition, outstanding shares of Series C Stock are subject to mandatory conversion into shares of Common Stock on the occurrence of certain events, including a public offering of the Common Stock pursuant to an effective registration statement and the written consent of holders of at least 50% of the then outstanding shares of Series C Stock.
58
Table of Contents
INSTITUTE FOR WEALTH HOLDINGS, INC.
Financial Statements
and Independent Auditors’ Report
and
Supplemental Information
For Years Ended December 31, 2016 and 2015
59
Table of Contents
Table of Contents

|
CHAPMAN, HEXT & CO., P.C. | 5001 Spring Valley Road, Ste. 850W | ||
| An Integrated Professional Services Firm | Dallas, TX 75244-3946 | |||
| Certified Public Accountants | (972) 644-7112 Fax (972) 680-8685 | |||
| Management Consultants | www.chapmanhext.com |
To the Board of Directors and Stockholders of
Institute for Wealth Holdings, Inc.
Dallas, Texas
Report on the Financial Statements
We have audited the accompanying financial statements of Institute for Wealth Holdings, Inc. (a Delaware corporation), which comprise the balance sheets as of December 31, 2016 and 2015, and the related statements of operations, stockholders’ equity, and cash flows for the years then ended, and the related notes to the financial statements.
Management’s Responsibility for the Financial Statements
Management is responsible for the preparation and fair presentation of these financial statements in accordance with accounting principles generally accepted in the United States of America; this includes the design, implementation, and maintenance of internal control relevant to the preparation and fair presentation of financial statements that are free from material misstatement, whether due to fraud or error.
Auditors’ Responsibility
Our responsibility is to express an opinion on these financial statements based on our audit. We conducted our audit in accordance with auditing standards generally accepted in the United States of America. Those standards require that we plan and perform the audit to obtain reasonable assurance about whether the financial statements are free from material misstatement.
An audit involves performing procedures to obtain audit evidence about the amounts and disclosures in the financial statements. The procedures selected depend on the auditor’s judgment, including the assessment of the risks of material misstatement of the financial statements, whether due to fraud or error. In making those risk assessments, the auditor considers internal control relevant to the entity’s preparation and fair presentation of the financial statements in order to design audit procedures that are appropriate in the circumstances, but not for the purpose of expressing an opinion on the effectiveness of the entity’s internal control. Accordingly, we express no such opinion. An audit also includes evaluating the appropriateness of accounting policies used and the reasonableness of significant accounting estimates made by management, as well as evaluating the overall presentation of the financial statements.
We believe that the audit evidence we have obtained is sufficient and appropriate to provide a basis for our audit opinion.
Opinion
In our opinion, the financial statements referred to above present fairly, in all material respects, the financial position of Institute for Wealth Holdings, Inc. as of December 31, 2016 and 2015, and the results of its operations and its cash flows for the year then ended in accordance with accounting principles generally accepted in the United States of America.
Report on Supplemental Information Unaudited – Institute for Wealth Management Holdings, Inc.
The form and content of the information included in the financial statements and supplemental information, as it pertains to Institute for Wealth Management Holdings, Inc., have not been audited by us in accordance with auditing standards generally accepted in the United States of America and we do not express an opinion on the financial position of Institute for Wealth Management Holdings, Inc. as of September 30, 2016 and 2015.
MEMBER OF AMERICAN INSTITUTE OF CERTIFIED PUBLIC ACCOUNTANTS, TEXAS SOCIETY OF CERTIFIED PUBLIC ACCOUNTANTS AND PRIVATE COMPANIES PRACTICE SECTION (PCPS)
Table of Contents
Institute for Wealth Holdings, Inc.
Page 2
Report on Supplemental Information Unaudited – Institute for Wealth Holdings, Inc. Pro Forma
The form and content of the pro forma information included in the supplemental information, as it pertains to Institute for Wealth Holdings, Inc. and Institute for Wealth Management Holdings, Inc., have not been audited by us in accordance with auditing standards generally accepted in the United States of America and we do not express an opinion on the financial position of Institute for Wealth Holdings, Inc. and Institute for Wealth Management Holding, Inc., as of December 31, 2016 and 2015.

Dallas, Texas
January 19, 2018
MEMBER OF AMERICAN INSTITUTE OF CERTIFIED PUBLIC ACCOUNTANTS, TEXAS SOCIETY OF CERTIFIED PUBLIC ACCOUNTANTS AND PRIVATE COMPANIES PRACTICE SECTION (PCPS)
Table of Contents
INSTITUTE FOR WEALTH HOLDINGS, INC.
CONSOLIDATED BALANCE SHEETS
As of December 31, 2016 and 2015
| December 31, | ||||||||
| 2016 | 2015 | |||||||
| ASSETS | ||||||||
| Current Assets: |
||||||||
| Cash and cash equivalents |
$ | 37,491 | $ | 10,223 | ||||
| Accounts receivable, net |
41,662 | 34,044 | ||||||
| Prepaid expenses |
20,388 | 3,633 | ||||||
|
|
|
|
|
|||||
| Total Current Assets |
99,541 | 47,900 | ||||||
|
|
|
|
|
|||||
| Property, Equipment and Software, net |
10,618 | 2,446 | ||||||
| Other Assets: |
||||||||
| Other intangible assets net of amortization |
10,037 | — | ||||||
| Deferred tax asset, noncurrent portion |
1,875,518 | 619,722 | ||||||
| Goodwill, net |
3,077,459 | — | ||||||
|
|
|
|
|
|||||
| Total Other Assets |
4,963,014 | 619,722 | ||||||
|
|
|
|
|
|||||
| Total Assets |
$ | 5,073,173 | $ | 670,068 | ||||
|
|
|
|
|
|||||
| December 31, | ||||||||
| 2016 | 2015 | |||||||
| LIABILITIES | ||||||||
| Current Liabilities: |
||||||||
| Line of credit |
$ | 87,079 | $ | — | ||||
| Accounts payable and accrued expenses |
225,395 | 113,606 | ||||||
| Accrued interest |
163,738 | 138,625 | ||||||
|
|
|
|
|
|||||
| Total Current Liabilities |
476,212 | 252,231 | ||||||
|
|
|
|
|
|||||
| Long-Term Liabilities: |
||||||||
| Employee health benefits |
46,656 | — | ||||||
| Deferred compensation |
932,903 | 397,222 | ||||||
| Notes payable |
2,874,178 | 648,828 | ||||||
|
|
|
|
|
|||||
| Total Long-Term Liabilities |
3,853,737 | 1,046,050 | ||||||
|
|
|
|
|
|||||
| Total Liabilities |
$ | 4,329,949 | $ | 1,298,281 | ||||
|
|
|
|
|
|||||
| STOCKHOLDERS’ EQUITY (DEFICIT) | ||||||||
| Stockholders’ Equity (Deficit): |
||||||||
| Series A Convertible preferred stock - par value $0.001; |
$ | — | $ | 30,000 | ||||
| 2015: 1,000,000 shares authorized: 3,000 shares issued and outstanding |
||||||||
| 2016: 5,000 shares authorized: zero shares issued and outstanding |
||||||||
| Series B Convertible preferred stock - par value $0.001; |
591,800 | 606,800 | ||||||
| 2015: 70,000 shares authorized: 60,680 shares authorized and outstanding |
||||||||
| 2016: 70,000 shares authorized: 59,180 shares issued and outstanding |
||||||||
| Series C Convertible preferred stock - par value $0.001; |
1,836,828 | — | ||||||
| 2016: 1,925,000 shares authorized: 1,904,404 shares issued and outstanding |
||||||||
| Common stock - par value $0.001; |
2,679 | 2,083 | ||||||
| 2015: 10,000,000 shares authorized; 2,082,640 shares issued and outstanding |
||||||||
| 2016: 10,000,000 shares authorized; 2,678,210 shares issued and outstanding |
||||||||
| Common stock additional paid-in capital |
589,504 | 248,211 | ||||||
| Retained earnings |
(2,277,587 | ) | (1,515,307 | ) | ||||
|
|
|
|
|
|||||
| Total Stockholders’ Equity (Deficit) |
743,224 | (628,213 | ) | |||||
|
|
|
|
|
|||||
| Total Liabilities and Stockholders’ Equity (Deficit) |
$ | 5,073,173 | $ | 670,068 | ||||
|
|
|
|
|
|||||
The accompanying notes are an integral part of these financial statements.
63
Table of Contents
INSTITUTE FOR WEALTH HOLDINGS, INC.
CONSOLIDATED STATEMENTS OF OPERATIONS
For the Years Ended December 31, 2016 and 2015
| For Years Ended December 31, | ||||||||
| 2016 | 2015 | |||||||
| Revenue: |
||||||||
| Investment management (IWM) |
$ | 58,927 | $ | — | ||||
| Investment advisory (IWA & IWM) |
803,013 | 454,678 | ||||||
| Subadvisory |
12,544 | — | ||||||
| 401(k) advisory |
2,689 | — | ||||||
| Life & annuity (ILA) |
92,376 | 198,605 | ||||||
| Advisor services (IWP) |
14,903 | 12,824 | ||||||
|
|
|
|
|
|||||
| Total Revenue |
984,452 | 666,107 | ||||||
|
|
|
|
|
|||||
| Cost of Revenue: |
||||||||
| Fees paid to IAR’s (IWM and IWA) |
592,275 | 354,011 | ||||||
| Fees paid to third party firms |
12,217 | — | ||||||
| Commissions to agents (ILA) |
99,880 | 127,089 | ||||||
|
|
|
|
|
|||||
| Total Cost of Revenue |
704,372 | 481,100 | ||||||
|
|
|
|
|
|||||
| Gross Profit |
280,080 | 185,007 | ||||||
| Operating Expenses: |
||||||||
| General and administrative |
77,313 | 22,232 | ||||||
| Salary and benefits |
324,599 | 105,435 | ||||||
| Rent and maintenance |
75,170 | 54,488 | ||||||
| Advertising and marketing |
76,715 | 29,866 | ||||||
| Technology and data subscriptions |
38,926 | 14,253 | ||||||
| Legal and professional |
37,548 | 10,867 | ||||||
|
|
|
|
|
|||||
| Total Operating Expenses |
630,271 | 237,141 | ||||||
|
|
|
|
|
|||||
| Net Operating Income (Loss) |
(350,191 | ) | (52,134 | ) | ||||
| Non Operating Income: |
||||||||
| Interest income |
1 | 226,473 | ||||||
| Gain from debt settlement |
385,017 | — | ||||||
|
|
|
|
|
|||||
| Total Non Operating Income: |
385,018 | 226,473 | ||||||
| Non Operating Expenses: |
||||||||
| Depreciation and amortization |
3,142 | 1,164 | ||||||
| Interest expense |
85,876 | 24,280 | ||||||
| Mergers and acquisitions |
711,893 | — | ||||||
|
|
|
|
|
|||||
| Total Non Operating Expenses: |
800,911 | 25,444 | ||||||
|
|
|
|
|
|||||
| Net Income (Loss) Before Income Tax Expense |
(766,084 | ) | 148,895 | |||||
|
|
|
|
|
|||||
| Income Tax (Credit) Expense |
(3,804 | ) | 31,610 | |||||
|
|
|
|
|
|||||
| Net Income (Loss) |
$ | (762,280 | ) | $ | 117,285 | |||
|
|
|
|
|
|||||
The accompanying notes are an integral part of these financial statements.
64
Table of Contents
INSTITUTE FOR WEALTH HOLDINGS, INC.
CONSOLIDATED STATEMENTS OF STOCKHOLDERS’ EQUITY (DEFICT)
As of December 31, 2016 and 2015
| Series A | Series B | Series C | Additional | |||||||||||||||||||||||||||||||||||||||||
| Preferred Stock | Preferred Stock | Preferred Stock | Common Stock | Paid-In | Retained | |||||||||||||||||||||||||||||||||||||||
| Shares | Amount | Shares | Amount | Shares | Amount | Shares | Amount | Capital | Earnings | Total | ||||||||||||||||||||||||||||||||||
| Balance at December 31, 2014 |
3,000 | $ | 30,000 | 60,680 | $ | 606,800 | — | $ | — | 1,948,640 | $ | 1,949 | $ | 246,825 | $ | (1,632,592 | ) | $ | (747,018 | ) | ||||||||||||||||||||||||
|
|
|
|
|
|
|
|
|
|
|
|
|
|
|
|
|
|
|
|
|
|
|
|||||||||||||||||||||||
| Common stock issued |
— | — | — | — | — | — | 134,000 | 134 | 1,386 | — | 1,520 | |||||||||||||||||||||||||||||||||
| Net income |
— | — | — | — | — | — | — | — | — | 117,285 | 117,285 | |||||||||||||||||||||||||||||||||
|
|
|
|
|
|
|
|
|
|
|
|
|
|
|
|
|
|
|
|
|
|
|
|||||||||||||||||||||||
| Balance at December 31, 2015 |
3,000 | $ | 30,000 | 60,680 | $ | 606,800 | — | $ | — | 2,082,640 | $ | 2,083 | $ | 248,211 | $ | (1,515,307 | ) | $ | (628,213 | ) | ||||||||||||||||||||||||
|
|
|
|
|
|
|
|
|
|
|
|
|
|
|
|
|
|
|
|
|
|
|
|||||||||||||||||||||||
| Common stock issued |
— | — | — | — | — | — | 120,000 | 120 | — | — | 120 | |||||||||||||||||||||||||||||||||
| Warrants Exercised |
— | — | — | — | — | — | 122,500 | 123 | 1,102 | — | 1,225 | |||||||||||||||||||||||||||||||||
| Preferred Stock Retired |
(3,000 | ) | (30,000 | ) | (1,500 | ) | (15,000 | ) | — | — | — | — | — | — | (45,000 | ) | ||||||||||||||||||||||||||||
| Merger & Acquisition |
— | — | — | — | 1,904,404 | 1,836,828 | 353,070 | 353 | 340,191 | — | 2,177,372 | |||||||||||||||||||||||||||||||||
| Net loss |
— | — | — | — | — | — | — | — | — | (762,280 | ) | (762,280 | ) | |||||||||||||||||||||||||||||||
|
|
|
|
|
|
|
|
|
|
|
|
|
|
|
|
|
|
|
|
|
|
|
|||||||||||||||||||||||
| Balance at December 31, 2016 |
— | $ | — | 59,180 | $ | 591,800 | 1,904,404 | $ | 1,836,828 | 2,678,210 | $ | 2,679 | $ | 589,504 | $ | (2,277,587 | ) | $ | 743,224 | |||||||||||||||||||||||||
|
|
|
|
|
|
|
|
|
|
|
|
|
|
|
|
|
|
|
|
|
|
|
|||||||||||||||||||||||
The accompanying notes are an integral part of these financial statements.
65
Table of Contents
INSTITUTE FOR WEALTH HOLDINGS, INC.
CONSOLIDATED STATEMENTS OF CASH FLOWS
For the Years Ended December 31, 2016 and 2015
| For Years Ended December 31, | ||||||||
| 2016 | 2015 | |||||||
| Cash Flows from Operating Activities: |
||||||||
| Net income (loss) |
$ | (762,280 | ) | $ | 117,285 | |||
| Adjustments to reconcile net income (loss) to net cash provided by (used in) operating activities: |
||||||||
| Depreciation and amortization |
3,142 | 1,354 | ||||||
| Increase (decrease) in: |
||||||||
| Accounts receivable |
8,290 | 57,295 | ||||||
| Prepaid expenses |
(7,087 | ) | (1,926 | ) | ||||
| Vendor write-off |
(222,833 | ) | ||||||
| Deferred tax Asset |
(3,804 | ) | 31,610 | |||||
| Accounts payable and accrued expenses |
180,000 | 16,644 | ||||||
| Deferred compensation |
(301,764 | ) | — | |||||
|
|
|
|
|
|||||
| Net Cash Provided by Operating Activities |
(883,503 | ) | (571 | ) | ||||
|
|
|
|
|
|||||
| Cash Flows from Investing Activities: |
||||||||
| Purchase of intangible assets |
(9,751 | ) | — | |||||
| Purchase of fixed assets |
(2,366 | ) | — | |||||
| Cash acquired in merger |
187,665 | — | ||||||
|
|
|
|
|
|||||
| Net Cash Used in Investing Activities |
175,548 | — | ||||||
|
|
|
|
|
|||||
| Cash Flows from Financing Activities: |
||||||||
| Net change in notes payable |
778,877 | (1,540 | ) | |||||
| Purchase of preferred stock |
(45,000 | ) | — | |||||
| Issuance (purchase) of common stock, par value |
243 | 134 | ||||||
| Additions to paid in capital |
1,103 | 1,386 | ||||||
|
|
|
|
|
|||||
| Net Cash Used in Financing Activities |
735,223 | (20 | ) | |||||
|
|
|
|
|
|||||
| Net Increase (Decrease) in Cash and Cash Equivalents |
27,268 | (591 | ) | |||||
| Cash and Cash Equivalents, beginning of year |
10,223 | 10,814 | ||||||
|
|
|
|
|
|||||
| Cash and Cash Equivalents, end of year |
$ | 37,491 | $ | 10,223 | ||||
|
|
|
|
|
|||||
| Supplemental Cash Flow Information: |
||||||||
| Interest paid |
$ | 63,287 | $ | — | ||||
|
|
|
|
|
|||||
| Non-Cash Transactions |
||||||||
| Fair value of net assets purchased in merger with IWM |
2,177,371 | — | ||||||
| Value of shares issued to shareholders of IWM |
2,177,371 | — | ||||||
|
|
|
|
|
|||||
| Net Cash effect of merger with IWM |
$ | — | $ | — | ||||
|
|
|
|
|
|||||
The accompanying notes are an integral part of these financial statements.
66
Table of Contents
INSTITUTE FOR WEALTH HOLDINGS, INC.
NOTES TO CONSOLIDATED FINANCIAL STATEMENTS
For the Years Ended December 31, 2016 and 2015
NOTE 1. SUMMARY OF ACCOUNTING POLICIES
Description of Business and Basis of Presentation
The Institute for Wealth Holdings, Inc. (“IWH” or the “Company”), through its wholly owned subsidiaries; Institute for Wealth Advisors, Inc. (“IWA”) and Institute for Wealth Management, LLC (“IWM”) provides investment advisory, portfolio management, and financial planning through a network of registered investment advisors (“IARS”) to individual and institutional clients. Both IWM and IWA are registered with the SEC as a Registered Investment Adviser (“RIA”). The Company’s other subsidiary, Institute for Wealth Partners, Inc. (“IWP”) provides various advisor services, along with its affiliate, Institute for Life and Annuity, Inc. (“ILA”) to support IARs for life insurance and annuity sales. The Company acquired by merger the Institute for Wealth Management Holding, Inc. (“IWMH”), the holding company of IWM, on September 12, 2016. The financial statements for IWH include the fourth quarter 2016 financial results of IWM. The majority of revenue is derived from a full range of services related to investment management and investment advisory services from retail, 401(k), sub advisory fees and life insurance and annuity sales. The Company was incorporated in Delaware on September 3, 2008 and operations are based primarily in Dallas, Texas. Its wealth management division operates primarily in Denver, Colorado. The Company’s fiscal year ends on December 31.
Principles of Consolidation
The accompanying consolidated financial statements present the consolidated financial position, results of operations and cash flows of the Company and its subsidiaries. Significant intercompany balances and transactions have been eliminated.
Use of Estimates
The accompanying consolidated financial statements have been prepared in accordance with accounting principles generally accepted in the United States of America that require management to make estimates and assumptions that affect the reported amounts of assets and liabilities, the disclosure of contingent assets and liabilities, the reported amount of revenues and expenses during the reporting period, as well as the accompanying notes. These estimates are based on information available to the Company. Actual results could differ from these estimates.
Basis of Accounting
The consolidated financial statements of the Company are prepared on the accrual basis of accounting. The accompanying consolidated financial statements include the accounts of the Company and its wholly owned subsidiaries. All material intercompany accounts and transactions have been eliminated in consolidation.
Cash and Cash Equivalents
Cash and cash equivalents consist primarily of cash in the bank and cash investments which have an initial maturity of three months or less. Cash equivalents are valued at cost, which approximates market.
Accounts Receivable
Receivables recorded in the financial statements represent valid claims against debtors for services rendered or other charges arising on or before the balance sheet date. Management makes estimates of the collectability of accounts receivable. Specifically, Management analyzes accounts receivable and historical bad debts, customer credit-worthiness, current economic trends, and changes in customer payment terms and collections trends when evaluating the adequacy of the allowance for doubtful accounts. Any change in the assumptions used in analyzing a specific accounts receivable may result in additional allowances for doubtful accounts being recognized in the periods in which the change occurs. Historically, losses from uncollectible accounts have not been significant, and management has determined that no allowance is necessary as of December 31, 2016 and 2015.
67
Table of Contents
INSTITUTE FOR WEALTH HOLDINGS, INC.
NOTES TO CONSOLIDATED FINANCIAL STATEMENTS
For the Years Ended December 31, 2016 and 2015
NOTE 1. SUMMARY OF ACCOUNTING POLICIES (CONTINUED)
Property, Equipment and Software
Property and equipment are recorded at cost. Depreciation is computed using the straight-line method over the life of the contract or estimated useful lives ranging from three to seven years. Costs incurred for upgrades and enhancements, which will not result in additional functionality, are expensed as incurred.
Goodwill and Purchase Price Allocation
The mergers and acquisitions (“M&A”) by the Company are accounted for using the purchase method of accounting. For this purpose, identifiable assets acquired and liabilities and contingent liabilities assumed through business combinations are measured at their fair value at the acquisition date. The cost of an acquisition is measured as the Company’s best estimate of fair value at the date of purchase in exchange for the consideration or, assets given, liabilities assumed and any equity or debt instruments issued by the Company in exchange for title or control, plus any costs directly attributable to the acquisition.
The excess of the cost of acquisition over the Company’s estimate of fair value of the acquired assets and liabilities is recorded as goodwill.
The Company tests goodwill semi-annually for impairment. The assessment as to whether long-lived assets are impaired is highly subjective. The calculations involve management’s best estimate of the holding period, investment returns and attrition rates. Many factors may influence management’s estimate of impairment. These conditions may change in a relatively short period of time. No impairment was recognized for the period ended December 31, 2016.
Income and Other Taxes
The determination of the Company’s provision for income taxes requires significant judgment, the use of estimates, and the interpretation and application of complex tax laws. Significant judgment is required in assessing the timing and amounts of deductible and taxable items.
The Company files an income tax return for Institute for Wealth Holdings, Inc. and subsidiaries as a single consolidated tax return.
Deferred income taxes are determined based on the difference between financial statement and tax basis of assets and liabilities using enacted tax rates in effect for the years in which such differences are expected to reverse. The temporary differences in these financial statements relate primarily to a net operating loss (“NOL”) carry-forward, deferred compensation and notes payable. Management routinely evaluates all deferred tax accounts to determine the likelihood of their realization. See Note 6 for discussion of income taxes.
Interest and penalties on income tax related items are included within the income tax provision and are accrued through Income Tax expense. Interest and penalties on any other tax expense are recorded in other operating expenses.
In the normal course of business, the Company and its subsidiaries consolidated tax return may be subject to an Internal Revenue Service (“IRS”) audit. As of the date of this report, management has not been notified that it is subject to an IRS audit and further, the Company is not aware of any proposed adjustments by the IRS that may directly impact the Company. The federal income tax returns of the Company for 2015, 2014 and 2013 are subject to examination by IRS, generally for three years after they are filed.
68
Table of Contents
INSTITUTE FOR WEALTH HOLDINGS, INC.
NOTES TO CONSOLIDATED FINANCIAL STATEMENTS
For the Years Ended December 31, 2016 and 2015
NOTE 1. SUMMARY OF ACCOUNTING POLICIES (CONTINUED)
Revenue Recognition
Investment management and investment advisory fee revenues are computed under individual agreements between IWM, IWA and various clients for which these subsidiary RIAs act as an advisor or subadvisor. These fees are generally based on the market value of the assets under management (“AUM”). Advisory fees are recognized as revenue as services are performed.
The Company, through its RIAs and investment advisory representatives (“IARs”) provide various investment advisory and sub-advisory services for clients. These fees are generally based on the current market value of the assets under management. Sub-advisory fees are recognized as revenue during the period such services are performed and are presented net of expense reimbursements, customer refunds and shareholder servicing fees.
Fair Values of Financial Instruments
FASB ASC 825-10-50 requires the Company to disclose estimated fair values for its financial instruments. Management has estimated the fair values of cash and cash equivalents, receivables, prepaid expenses, accounts payable and accrued expenses to be approximately their respective carrying values reported on these statements because of their short maturities.
Concentration Risk
The Company provides, through IWM and IWA, investment advisory and related services to IARs, customers and clients in approximately twenty states. The Company believes that it does not have individually or significantly large client accounts or revenue concentrations that, in the event of the loss of such client account(s), would materially or adversely impact the Company.
NOTE 2. DEFERRED COMPENSATION
The Company has entered into agreements with its two executive officers to defer annual compensation. Deferred compensation balances as of December 31, 2016 and 2015 are $932,903 and $397,222, respectively.
NOTE 3. GOODWILL
The Company acquired Institute for Wealth Management Holdings, Inc. (“IWMH”), the holding company of IWM, on September 12, 2016. The strategy behind the merger of IWM into IWH was to operate a dual investment advisory and investment management platform for the IARs and clients through these RIA subsidiaries, which provide investment management and advisory services to clients by enrolling, supporting and supervising qualified registered investment advisors (“IARs”).
The total purchase price of this transaction was $4,551,924, which consisted of $2,177,371 of the Company’s shares and $2,374,553 of assumed IWM debt.
69
Table of Contents
INSTITUTE FOR WEALTH HOLDINGS, INC.
NOTES TO CONSOLIDATED FINANCIAL STATEMENTS
For the Years Ended December 31, 2016 and 2015
NOTE 3. GOODWILL (CONTINUED)
The Company acquired 100% of IWM through a merger transaction with the exchange of the Company’s shares for the outstanding shares of IWMH. The IWH shares issued to IWMH shareholders were as follows:
| IWH Shares Issued/Exchanged to IWHM Shareholders |
||||
| Common Stock |
353,069 | |||
| Preferred Stock Series C |
1,904,404 | |||
|
|
|
|||
| Total IWH Shares Issued/Exchanged to IWMH Shareholders |
2,257,473 | |||
| IWMH Shares Outstanding Pre-Merger |
||||
| Common Stock |
220,489 | |||
| Preferred Shares Series A |
1,189,286 | |||
|
|
|
|||
| Total IWMH Shares Outstanding Pre-Merger |
1,409,775 | |||
Upon the merger and acquisition of IWMH and IWM, the Company allocated the purchase price to acquired tangible assets, consisting of current assets, prepaid assets, equipment and technology, deferred assets and intangible assets.
| Assets Acquired |
||||
| Cash |
$ | 187,665 | ||
| Accounts Receivable |
15,908 | |||
| Prepaid Expenses |
9,668 | |||
| Furniture, Equipment and Software |
8,946 | |||
| Deferred Assets and Other Intangibles |
1,252,278 | |||
| Goodwill |
3,077,459 | |||
|
|
|
|||
| Total Asset Acquired |
$ | 4,551,924 | ||
|
|
|
|||
| Payables, Accrued Expenses and Debt Assumed |
||||
| Accounts Payable and Accrued Expenses |
$ | 137,033 | ||
| Long Term Debt |
2,237,520 | |||
|
|
|
|||
| Total Payables, Accrued Expenses and Debt Assumed |
$ | 2,374,553 | ||
|
|
|
|||
| Value of IWH Shares Issued/Exchanged |
||||
| Common Stock Issued/Exchanged |
$ | 340,543 | ||
| Preferred Stock Series C Issued/Exchanged |
1,836,828 | |||
|
|
|
|||
| Total Value of IWH Shares Issued/Exchanged |
$ | 2,177,371 | ||
|
|
|
|||
In connection with the acquisition of IWM, the Company incurred transaction costs of $711,893 and other expenses and transaction costs, which are listed in the accompanying statement of operations.
70
Table of Contents
INSTITUTE FOR WEALTH HOLDINGS, INC.
NOTES TO CONSOLIDATED FINANCIAL STATEMENTS
For the Years Ended December 31, 2016 and 2015
NOTE 4. NOTES PAYABLE
Notes Payable
The Company has various notes payable to individuals with interest rates ranging from 7.5% - 12% per year and a default rate of interest of 9% - 12% per year. These notes mature at dates ranging from June 15, 2012 to March 1, 2017, which have been extended and/or waived by agreement with the parties. The notes payable balances as of December 31, 2016 and 2015 were $759,178 and $433,828 respectively.
Debenture Notes
The Company has various convertible debentures owed to individuals with interest rates ranging from 8% - 12% per year and a default rate of interest of 18% per year. These debenture notes call for principal and interest payments to mature December 31, 2009, and were extended annually by agreement with the parties. The debenture notes may be converted to common stock at $2.50 per share. As of December 31, 2016 and 2015, these notes include accrued interest of $155,463 and $135,463, respectively. The convertible debentures balances as of December 31, 2016 and 2015 were $215,000, respectively.
Senior Secured Notes
The Company issued $1,900,000 of 8% Senior Secured Notes to several individual investors in connection with the IWM merger in September 2016 which mature September 30, 2021. The senior notes are collateralized with corporate stock and membership interests of IWA and IWM subsidiaries. The senior notes call for quarterly interest-only payments with the principal due in full on September 30, 2021. The senior notes payable as of December 31, 2016 and 2015 were $1,900,000 and $0, respectively.
Line of Credit
IWM has a $100,000 working capital line of credit with a financial institution with no stated maturity date. Interest is payable monthly at prime plus 1% (4.75% at December 31, 2016). The line is collateralized by all of the equipment and assets of IWM and guaranteed by IWM’s manager. Outstanding borrowings under the agreement at December 31, 2016 amounted to $87,079.
NOTE 5. COMMITMENTS AND CONTIGENCIES
Operating Leases
The Company leases facilities in both Dallas and Denver under non-cancelable operating leases. Rent expense for years ended December 31, 2016 and 2015 were $75,170 and $54,488, respectively.
71
Table of Contents
INSTITUTE FOR WEALTH HOLDINGS, INC.
NOTES TO CONSOLIDATED FINANCIAL STATEMENTS
For the Years Ended December 31, 2016 and 2015
NOTE 5. COMMITMENTS AND CONTIGENCIES (CONTINUED)
Minimum future rental commitments under these lease agreements as of December 31, 2016 are as follows:
| Year |
Dallas, TX Office Space |
Year |
Denver, CO Office Space |
|||||||||||
| 2017 |
$ | 52,068 | 2017 | $ | 12,265 | |||||||||
| 2018 |
59,499 | 2018 | — | |||||||||||
| 2019 |
61,302 | 2019 | — | |||||||||||
| Thereafter |
— | Thereafter | — | |||||||||||
|
|
|
|
|
|||||||||||
| Total |
$ | 172,869 | Total | $ | 12,265 | |||||||||
|
|
|
|
|
|||||||||||
Litigation
In the normal course of business, the Company may be subject to various legal proceedings and claims. The Company’s management is not aware of any threatened claim or potential liability that could materially affect its financial condition.
NOTE 6. INCOME TAX PROVISION
Income tax expense (benefit) consists of the following:
| 2016 | 2015 | |||||||
| Deferred Income Tax Provision (Benefit) |
(3,804 | ) | 31,610 | |||||
|
|
|
|
|
|||||
| Total Net Provision from Income Taxes |
$ | (3,804 | ) | $ | 31,610 | |||
|
|
|
|
|
|||||
The net deferred tax assets (liabilities) are reported on the accompanying balance sheet as of December 31, 2016 and 2015:
| 2016 | 2015 | |||||||
| Net Deferred Tax Assets (Liabilities) - Non-current: |
||||||||
| Net Operating Losses |
$ | 1,414,917 | $ | 619,722 | ||||
| Deferred Compensation |
373,597 | — | ||||||
| Depreciation on property and equipment |
(1,678 | ) | — | |||||
| Amortization on intangible assets and software |
3,329 | — | ||||||
| Prepaids & receivables |
(9,266 | ) | — | |||||
| Accrued Expenses & Other Accured Liabilities |
92,219 | — | ||||||
| Other Deferred Tax Assets |
2,400 | — | ||||||
|
|
|
|
|
|||||
| Net Deferred Tax Assets (Liabilities) - Non-current |
$ | 1,875,518 | $ | 619,722 | ||||
|
|
|
|
|
|||||
The provision for income taxes shown on the Statements of Operations differ from the amount that would result from applying statutory tax rates to income before income taxes primarily because of the blended marginal tax rate (estimated at approximately 31% at December 31, 2016) used to compute deferred taxes, and permanent differences between determining income for financial statement purposes and computing taxable income. Permanent differences are primarily from nondeductible meals and entertainment expenses and other tax return adjustments.
72
Table of Contents
INSTITUTE FOR WEALTH HOLDINGS, INC.
NOTES TO CONSOLIDATED FINANCIAL STATEMENTS
For the Years Ended December 31, 2016 and 2015
NOTE 7. RELATED PARTY TRANSACTIONS
The Company has several Senior Secured notes payable to officers, directors and shareholders. As of December 31, 2016, the outstanding balances due to related parties as holders of the senior notes were $875,000, described in Note 4.
NOTE 8. CAPITAL STRUCTURE
Preferred Stock
Current Preferred Stock outstanding includes the Company’s designated Series B and C Convertible Preferred Stock (the “Preferred Stock”). As of December 31, 2016, the Company had the following shares outstanding:
| Preferred Stock |
Authorized Shares | Outstanding Shares | ||||||
| Series A Convertible Preferred Stock |
5,000 | — | ||||||
| Series B Convertible Preferred Stock |
70,000 | 59,180 | ||||||
| Series C Convertible Preferred Stock |
1,925,000 | 1,904,404 | ||||||
|
|
|
|
|
|||||
| Total Preferred Stock |
2,000,000 | 1,963,584 | ||||||
Series B Convertible Preferred Stock
Series B Convertible Preferred Stock ranks on par with Series C Convertible Preferred Stock with respect to dividends, redemption, liquidation, dissolution and winding up. Series B Convertible Preferred Stock has a cumulative dividend rate of 7% per annum, accruing quarterly, payable as declared by the Company’s Board of Directors. The dividend rate payable on the Series B Convertible Preferred Stock is indexed to the Consumer Price Index if such index is 7% or greater. The Series B Convertible Preferred Stock does not have the right to vote, except for (i) an amendment to any right applicable to Series B Convertible Preferred Stock or provisions to the Certificate of Incorporation that adversely affects Series B Convertible Preferred Stock, (ii) the creation of a class of stock, unless such stock ranks junior to Series B Convertible Preferred Stock with respect to dividends and liquidation preference, or (iii) the issuance or obligation to issue additional Series B Convertible Preferred Stock or Series C Convertible Preferred Stock. In the event of a liquidation, holders of Series B Convertible Preferred Stock are entitled to the greater of $10 per share plus any accumulated but unpaid dividends or the amount such share would have been entitled to had it been converted into common stock. Each share of Series B Convertible Preferred Stock is convertible into four shares of common stock at a conversion price of $2.50 per share at the election of the holder. As of December 31, 2016 and 2015, there were un-declared dividends in the amount of $283,397 and $241,942, respectively.
Series C Convertible Preferred Stock
Holders of Series C Convertible Preferred Stock vote as a class with the common stock on an as converted basis. An affirmative vote of the majority of the Series C Convertible Preferred Stock is needed to (i) amend any right applicable to Series C Convertible Preferred Stock or any provision of the Certificate of Incorporation that adversely affects Series C Convertible Preferred Stock, (ii) create a class of stock, unless such stock ranks junior to Series C Convertible Preferred Stock with respect to dividends and liquidation, or (iii) issue or obligate the Company to issue any additional shares of Series B Convertible Preferred Stock or Series C Convertible Preferred Stock. In the event of a liquidation, holders of Series C Convertible Preferred Stock are entitled to the greater of $1.2489 per share plus
73
Table of Contents
INSTITUTE FOR WEALTH HOLDINGS, INC.
NOTES TO CONSOLIDATED FINANCIAL STATEMENTS
For the Years Ended December 31, 2016 and 2015
NOTE 8. CAPITAL STRUCTURE (CONTINUED)
any accumulated but unpaid dividends or the amount such share would have been entitled to had it been converted into common stock. Holders of Series C Convertible Preferred Stock may elect to convert their shares into shares of common stock. The Series C Convertible Preferred Stock currently pays no dividend.
After the payment of the full liquidation preference of Preferred Stock, the remaining assets of the Company legally available for distribution are to be distributed ratably to the holders of common stock. However, a Preferred Stockholder is entitled to receive, on a pro rata basis, the greater of the amount of cash, securities, or other property the Preferred Stockholder would be entitled to receive in a liquidation event if the Preferred Stock had been converted to common stock immediately prior to the acquisition or asset transfer.
Warrants
In connection with the 2009-2010 Series B Preferred Stock Offering, the Series B Preferred shares sold in the offering included detachable warrants which granted the investors the right to purchase common stock at $2.50 per share in an amount equal to the number of preferred shares purchased. These warrants expire on December 31, 2019. As of December 31, 2016 and 2015, the number of warrants issued and outstanding were for 70,430 common shares.
In connection with the 8% Senior Secured Notes Offering in 2016, each investor was given a detachable warrant to purchase shares of common stock. For every $100,000 of Senior Notes purchased, the investor was granted a warrant to purchase 10,000 shares of common stock at $0.01 per share. In 2016 a total of 197,500 warrants were issued in connection with the Senior Notes offering. As of December 31, 2016, a total of 122,500 warrants were exercised and 75,000 warrants remain outstanding.
Common Stock
The Company also has authorized a class of common stock, par value $0.001. As of December 31, 2016 and 2015, the authorized common stock was 10,000,000 shares. Total shares issued and outstanding as of December 31, 2016 and 2015, were 2,678,210 and 2,082,640, respectively.
NOTE 9. SUBSEQUENT EVENTS
The Company has evaluated subsequent events through January 19, 2018, the date which the financial statements were available to be issued.
In March 2017, the Company created an additional subsidiary known as Institute for Wealth Consultants, Inc., a Delaware corporation (“IWC”), which provides IAR support services, fee-based financial planning and access to life insurance and annuity products at ILA.
74
Table of Contents
INSTITUTE FOR WEALTH HOLDINGS, INC.
NOTES TO CONSOLIDATED FINANCIAL STATEMENTS
For the Years Ended December 31, 2016 and 2015
NOTE 9. SUBSEQUENT EVENTS (CONTINUED)
On March 1, 2017, The Institute for Wealth Management, LLC, a subsidiary, entered into the Third Amendment to Lease Agreement with U.S. Premier Office Equities, L.P. for its office space. This agreement extends the commercial lease from March 1, 2017 to May 31, 2020. Total minimum rental commitments at December 31, 2016 are as follows:
| Year |
Denver, CO Office Space |
|||
| 2017 |
$ | 35,401 | ||
| 2018 |
84,601 | |||
| 2019 |
86,273 | |||
| Thereafter |
36,238 | |||
|
|
|
|||
| Total |
$ | 242,513 | ||
|
|
|
|||
On July 6, 2017, a Senior Secured Note with an interest rate of 8% was issued for $100,000 to an individual, in connection with the IWM merger in September 2016. In conjunction with this note, the investor was issued and exercised 10,000 shares of common stock.
On October 1, 2017, the Company began offering up to a maximum of 2,500,000 shares of Series D Convertible Preferred Stock, par value $0.001, in a private offering. The offering period was from October 1, 2017 through December 20, 2017. IWH had the following Preferred Stock Series D transactions:
Sale of 76,637 shares of Series D Convertible Preferred Stock for a sum of $611,000.
Exchange of 16,430 shares of Series B Convertible Preferred Stock, including dividends, for 25,403 shares ($254,030) of Series D Convertible Preferred Stock.
Exchange of outstanding Senior 8% notes, plus accrued interest, in the amount of $1,375,000 for 140,260 shares ($1,402,600) of Series D Convertible Preferred Stock.
Exchange of $150,000 Note Payable for 25,000 shares ($250,000) of Series D Convertible Preferred Stock.
In December 2017, a shareholder of Series C Convertible Preferred Stock exercised its Put-Call agreement. The agreement calls for IWH to purchase all shares of Series C Convertible Preferred Stock held by such shareholder for $350,000. The transaction has a completion deadline of January 18, 2018. The Company anticipates negotiating a settlement with this shareholder.
In December 2017, the Company dissolved IWMH, the holding company for IWM acquired in September 2016, as IWMH no longer served any useful purpose.
In December 2017, the Tax Cuts and Jobs Act was passed by Congress. This legislation consists of a corporate tax rate reduction from 35% to 21%. This Act limits the NOL reduction in a carryback year or carryforward year to 80% of the taxable income that year determined without regard to the NOL reduction. NOLs may be carried forward indefinitely.
75
Table of Contents
SUPPLEMENTAL INFORMATION – UNAUDITED
INSTITUTE FOR WEALTH MANAGEMENT HOLDINGS, INC.
Financial Statements
For Nine Months Ended September 30, 2016
and
For Year Ended December 31, 2015
76
Table of Contents
INSTITUTE FOR WEALTH MANAGEMENT HOLDINGS, INC.
CONSOLIDATED BALANCE SHEET - UNAUDITED
As of September 30, 2016
| September 30, | ||||
| 2016 | ||||
| ASSETS | ||||
| Current Assets: |
||||
| Cash and cash equivalents |
$ | 187,665 | ||
| Accounts receivable, net |
15,908 | |||
| Prepaid expenses |
9,668 | |||
| Deferred tax asset, current portion |
56,505 | |||
|
|
|
|||
| Total Current Assets |
269,746 | |||
|
|
|
|||
| Property, Equipment and Software, net |
8,946 | |||
| Other Assets: |
||||
| Other intangible assets net of amortization |
286 | |||
| Deferred tax asset, noncurrent portion |
1,195,487 | |||
|
|
|
|||
| Total Other Assets |
1,195,773 | |||
|
|
|
|||
| Total Assets |
$ | 1,474,465 | ||
|
|
|
|||
| September 30, | ||||
| 2016 | ||||
| LIABILITIES | ||||
| Current Liabilities: |
||||
| Line of credit |
$ | 87,079 | ||
| Accounts payable and accrued expenses |
43,654 | |||
|
|
|
|||
| Total Current Liabilities |
130,733 | |||
|
|
|
|||
| Long-Term Liabilities: |
||||
| Employee health benefits payable |
46,981 | |||
| Deferred compensation |
837,445 | |||
| Notes payable |
539,395 | |||
|
|
|
|||
| Total Long-Term Liabilities |
1,423,821 | |||
|
|
|
|||
| Total Liabilities |
$ | 1,554,554 | ||
|
|
|
|||
| STOCKHOLDERS’ EQUITY (DEFICIT) | ||||
| Stockholders’ Equity (Deficit): |
||||
| Series A Convertible preferred stock - par value $0.0001; 10,000,000 shares issued and 1,189,286 shares outstanding |
$ | 83 | ||
| Common stock - par value $0.0001; 10,000,000 shares issued and 220,489 shares outstanding |
10 | |||
| Additional paid in capital |
999,909 | |||
| Retained earnings |
(1,080,091 | ) | ||
|
|
|
|||
| Total Stockholders’ Equity (Deficit) |
(80,089 | ) | ||
|
|
|
|||
| Total Liabilities and Stockholders’ Equity (Deficit) |
$ | 1,474,465 | ||
|
|
|
|||
Summary of Significant Accounting Policies
| 1. | This balance sheet represents the financial position of IWMH before merger and is presented exclusively of IWH. |
77
Table of Contents
INSTITUTE FOR WEALTH MANAGEMENT HOLDINGS, INC.
CONSOLIDATED STATEMENT OF OPERATIONS - UNAUDITED
For Nine Months Ended September 30, 2016
| For Nine Months Ended | ||||
| September 30, 2016 | ||||
| Revenue: |
||||
| Investment management (IWM) |
$ | 165,379 | ||
| Investment advisory (IWA) |
1,119,383 | |||
| Subadvisory |
67,698 | |||
| 401(k) advisory |
6,834 | |||
|
|
|
|||
| Total Revenue |
1,359,294 | |||
|
|
|
|||
| Cost of Revenue: |
||||
| Fees paid to IAR’s (IWM and IWA) |
662,382 | |||
| Fees paid to third party firms |
35,686 | |||
|
|
|
|||
| Total Cost of Revenue |
698,068 | |||
|
|
|
|||
| Gross Profit: |
661,226 | |||
| Operating Expenses: |
||||
| General and administrative |
65,967 | |||
| Salary and benefits |
597,590 | |||
| Rent and maintenance |
64,411 | |||
| Advertising and marketing |
24,492 | |||
| Technology and data subscriptions |
48,924 | |||
| Legal and professional |
83,409 | |||
|
|
|
|||
| Total Operating Expenses |
884,793 | |||
|
|
|
|||
| Net Operating Income (Loss) |
(223,567 | ) | ||
| Non Operating Income: |
||||
| Interest income |
2 | |||
| Gain from debt settlement |
1,329,322 | |||
|
|
|
|||
| Total Non Operating Income: |
1,329,324 | |||
| Non Operating Expenses: |
||||
| Depreciation and amortization |
5,061 | |||
| Interest expense |
204,124 | |||
| Mergers and acquisitions |
428 | |||
|
|
|
|||
| Total Non Operating Expenses: |
209,613 | |||
|
|
|
|||
| Net Income (Loss) Before Income Tax Expense |
896,144 | |||
|
|
|
|||
| Income Tax Expense |
— | |||
|
|
|
|||
| Net Income |
$ | 896,144 | ||
|
|
|
|||
Summary of Significant Accounting Policies
| 1. | This statement of operations represents the financial results of IWMH before merger and is presented exclusively of IWH. |
78
Table of Contents
INSTITUTE FOR WEALTH MANAGEMENT HOLDINGS, INC.
CONSOLIDATED STATEMENT OF STOCKHOLDERS’ EQUITY (DEFICIT) - UNAUDITED
As of September 30, 2016
| Additional | ||||||||||||||||||||||||||||
| Preferred Stock | Common Stock | Paid-In | Retained | |||||||||||||||||||||||||
| Shares | Amount | Shares | Amount | Capital | Earnings | Total | ||||||||||||||||||||||
| Balance at December 31, 2014 |
839,286 | $ | 83 | 25,000 | $ | 3 | $ | 749,916 | $ | (2,636,460 | ) | $ | (1,886,458 | ) | ||||||||||||||
|
|
|
|
|
|
|
|
|
|
|
|
|
|
|
|||||||||||||||
| Preferred stock issued |
350,000 | — | — | — | ||||||||||||||||||||||||
| Common stock issued |
— | — | 195,489 | 7 | 249,993 | — | 250,000 | |||||||||||||||||||||
| Net loss |
— | — | — | — | — | (159,775 | ) | (159,775 | ) | |||||||||||||||||||
|
|
|
|
|
|
|
|
|
|
|
|
|
|
|
|||||||||||||||
| Balance at December 31, 2015 |
1,189,286 | $ | 83 | 220,489 | $ | 10 | $ | 999,909 | $ | (2,796,235 | ) | $ | (1,796,233 | ) | ||||||||||||||
|
|
|
|
|
|
|
|
|
|
|
|
|
|
|
|||||||||||||||
| Membership Interest |
— | — | — | — | 820,000 | 820,000 | ||||||||||||||||||||||
| Net income |
— | — | — | — | — | 896,144 | 896,144 | |||||||||||||||||||||
|
|
|
|
|
|
|
|
|
|
|
|
|
|
|
|||||||||||||||
| Balance at September 30, 2016 |
1,189,286 | $ | 83 | 220,489 | $ | 10 | $ | 999,909 | $ | (1,080,091 | ) | $ | (80,089 | ) | ||||||||||||||
|
|
|
|
|
|
|
|
|
|
|
|
|
|
|
|||||||||||||||
Summary of Significant Accounting Policies
| 1. | This statement of stockholders’ equity (deficit) represents the financial position of IWMH before merger and is presented exclusively of IWH. |
79
Table of Contents
INSTITUTE FOR WEALTH MANAGEMENT HOLDINGS, INC.
CONSOLIDATED STATEMENT OF CASH FLOWS - UNAUDITED
For Nine Months Ended September 30, 2016
| For Nine Months Ended | ||||
| September 30, 2016 | ||||
| Cash Flows from Operating Activities: |
||||
| Net income |
$ | 896,144 | ||
| Adjustments to reconcile net income (loss) to net cash provided by (used in) operating activities: |
||||
| Depreciation and amortization |
5,061 | |||
| Increase (decrease) in: |
||||
| Accounts receivable |
1,294 | |||
| Prepaid expenses |
(122 | ) | ||
| Vendor write-off |
(73,414 | ) | ||
| Deferred tax Asset |
— | |||
| Accounts payable and accrued expenses |
(6,503 | ) | ||
| Deferred compensation |
(866,067 | ) | ||
|
|
|
|||
| Net Cash Provided by Operating Activities |
(43,607 | ) | ||
|
|
|
|||
| Cash Flows from Investing Activities: |
||||
| Purchase of fixed assets |
(1,350 | ) | ||
|
|
|
|||
| Net Cash Used in Investing Activities |
(1,350 | ) | ||
|
|
|
|||
| Cash Flows from Financing Activities: |
||||
| Net change in notes payable |
(472,418 | ) | ||
| Deferred compensation |
(270,532 | ) | ||
| Membership interest |
820,000 | |||
|
|
|
|||
| Net Cash Used in Financing Activities |
77,050 | |||
|
|
|
|||
| Net Increase (Decrease) in Cash and Cash Equivalents |
32,093 | |||
| Cash and Cash Equivalents , beginning of year |
155,572 | |||
|
|
|
|||
| Cash and Cash Equivalents, end of year |
$ | 187,665 | ||
|
|
|
|||
| Supplemental Cash Flow Information: |
||||
| Interest paid |
$ | 166,811 | ||
|
|
|
|||
Summary of Significant Accounting Policies
| 1. | This statement of cash flows represents the financial results of IWMH before merger and is presented exclusively of IWH. |
| 2. | Change in cash flow references periods from December 31, 2015 through September 30, 2016. |
80
Table of Contents
INSTITUTE FOR WEALTH MANAGEMENT HOLDINGS, INC.
NOTES TO CONSOLIDATED FINANCIAL STATEMENTS - UNAUDITED
For Nine Months Ended September 30, 2016
NOTE 1. SUMMARY OF ACCOUNTING POLICIES
Description of Business
Institute for Wealth Management Holdings, Inc. (the “Company”) through its wholly owned subsidiary, Institute for Wealth Management, LLC (“IWM”), performs investment advisory, portfolio management, and administrative services, and currently acts as an investment advisor or subadvisor to various individuals, institutions, and mutual funds.
Principles of Consolidation
The accompanying consolidated financial statements present the consolidated financial position, results of operations and cash flows of the Company and its subsidiary. Significant intercompany balances and transactions have been eliminated.
Basis of Presentation
The accompanying consolidated financial statements have been prepared in conformity with U.S. generally accepted accounting principles (“GAAP”).
Basis of Accounting
The consolidated financial statements of the Company are prepared on the accrual basis of accounting. The accompanying consolidated financial statements include the accounts of the Company and its wholly owned subsidiaries. All material intercompany accounts and transactions have been eliminated in consolidation.
Use of Estimates
The accompanying consolidated financial statements have been prepared in accordance with accounting principles generally accepted in the United States of America that require management to make estimates and assumptions that affect the reported amounts of assets and liabilities, the disclosure of contingent assets and liabilities, the reported amount of revenues and expenses during the reporting period, as well as the accompanying notes. These estimates are based on information available to the Company. Actual results could differ from these estimates.
Cash and Cash Equivalents
For cash flow purposes, the Company considers cash and temporary investments with original maturities of three months or less to be cash and cash equivalents. The Company evaluates the creditworthiness of the financial institutions with which it invests in determining the risk associated with these deposits.
Accounts Receivable
The Company records accounts receivable in the normal course of business. The Company periodically evaluates the collectability of receivables and considers a reserve for doubtful accounts based on the creditworthiness of the customer. When identified, uncollectible accounts are first charged against the reserve to the extent available, then to operations. Historically, losses from uncollectible accounts have not been significant, and management has determined that no allowance is necessary as of September 30, 2016.
Property and Equipment
Property and equipment is stated at cost and depreciated using straight-line methods over the estimated useful lives ranging from three to seven years. Expenditures for repairs and maintenance are expensed when paid.
81
Table of Contents
INSTITUTE FOR WEALTH MANAGEMENT HOLDINGS, INC.
NOTES TO CONSOLIDATED FINANCIAL STATEMENTS - UNAUDITED
For Nine Months Ended September 30, 2016
NOTE 1. SUMMARY OF ACCOUNTING POLICIES (CONTINUED)
Revenue Recognition
Retail product advisement revenues are computed under separate agreements between the Company and various clients for which it acts as an advisor or subadvisor. These fees are generally based on the market value of the assets under management. Advisory fees are recognized as revenue as services are performed. Certain advisory fees are presented net of expense reimbursements, customer refunds and shareholder servicing fees.
The Company provides various sub-advisory services for clients. These fees are generally based on the market value of the assets under management. Sub-advisory fees are recognized as revenue during the period such services are performed and are presented net of expense reimbursements, customer refunds and shareholder servicing fees.
Advertising and Marketing
Advertising and marketing costs are expensed as incurred. Advertising and marketing costs were $24,492 for the nine months ended September 30, 2016.
Income Taxes
Income taxes are provided for the tax effects of transactions reported in the financial statements and consist of taxes currently due plus deferred taxes related primarily to differences between the basis of certain assets and liabilities for financial and tax reporting. The deferred taxes represent the future tax return consequences of those differences, which will either be taxable or deductible when the assets and liabilities are recovered or settled. Deferred tax assets are limited to amounts considered to be realizable in future periods.
NOTE 2. DEFERRED COMPENSATION
During 2003, the Company entered into an agreement with their manager to defer annual compensation to future years. The balance outstanding as of September 30, 2016 is $837,445.
NOTE 3. INCOME TAXES
As of September 30, 2016, the Company had Federal net operating loss carryforwards of approximately $384,367. If such net operating loss carryforwards are not utilized, the federal net operating loss carryforwards will begin to expire in 2026.
NOTE 4. NOTES PAYABLE
Notes Payable
The Company has various notes payable to individuals with interest rates ranging from 7.5% - 12% per year and a default rate of interest of 9% - 14% per year. These notes have various dates of maturities, which have been extended and/or waived by agreement with parties. The notes payable balance as of September 30, 2016 was $539,395.
Line of Credit
The Company has a $100,000 working capital line of credit with a financial institution with no stated maturity date. Interest is payable monthly at prime plus 1% (4.50% at September 30, 2016). The line is collateralized by all of the equipment and assets of the Company and guaranteed by the Company’s manager. Outstanding borrowings under the agreement at September 30, 2016 amounted to $87,079.
82
Table of Contents
INSTITUTE FOR WEALTH MANAGEMENT HOLDINGS, INC.
NOTES TO CONSOLIDATED FINANCIAL STATEMENTS - UNAUDITED
For Nine Months Ended September 30, 2016
NOTE 5. STOCKHOLDERS’ EQUITY
Preferred Stock
Preferred Stock includes the Company’s designated Series A Convertible Preferred Stock (the “Preferred Stock”). The Company had 10,000,000 shares of Preferred Stock authorized at $0.0001 par value.
Preferred Stockholders shall be entitled to the number of votes equal to the number of whole shares of Common Stock into which the shares of Preferred Stock are convertible. Preferred Stockholders are entitled, at any time, to convert their shares into fully paid and non-assessable shares of Common Stock. The number of shares of Common Stock to which a holder of Preferred Stock can convert is obtained by multiplying the conversion rate that is in effect by the number of shares of Preferred Stock being converted. The conversion rate is determined by dividing the original issue price by the applicable conversion price. Preferred Stockholders are only entitled to receive cash dividends to the extent they are paid to Common Stockholders, in which case they will receive them on as as-if-converted basis.
Dividends are payable only when and if declared by the Board of Directors. In accordance with the Articles of Incorporation, upon any event of liquidation, dissolution, or winding up of the Company, any amounts that are available for distributions to its stockholders to be paid out of the assets of the Company are paid first to Preferred Stockholders in an amount per share of Preferred Stock equal to the greater of the original issue price of $2.00 per share plus declared and unpaid dividends or such amount as would have been received had each Preferred Stock share been converted into shares of Common Stock immediately prior to such liquidation.
After the payment of the full liquidation preference of Preferred Stock, the remaining assets of the Company legally available for distribution are to be distributed ratably to the holders of Common Stock. However, a Preferred Stockholder is entitled to receive, on a pro rata basis, the greater of the amount of cash, securities, or other property the Preferred Stockholder would be entitled to receive in a liquidation event if the Preferred Stock shares had been converted to Common Stock immediately prior to the acquisition or asset transfer.
NOTE 6. RELATED PARTY TRANSACTION
The company has several notes payable to shareholders. As of September 30, 2016, the outstanding balances due to related parties as holders of the notes were $539,395, described in Note 4.
NOTE 7. COMMITMENTS AND CONTINGENCIES
Operating Leases
IWM leases facilities under a non-cancelable operating lease. Rent expense for the nine months ended September 30, 2016 was $53,755.
Future minimum lease payments under this lease are as follows:
| Year |
Denver, CO Office Space |
|||
| 2017 |
$ | 12,265 | ||
| 2018 |
— | |||
| 2019 |
— | |||
| Thereafter |
— | |||
|
|
|
|||
| Total |
$ | 12,265 | ||
|
|
|
|||
83
Table of Contents
INSTITUTE FOR WEALTH MANAGEMENT HOLDINGS, INC.
NOTES TO CONSOLIDATED FINANCIAL STATEMENTS - UNAUDITED
For Nine Months Ended September 30, 2016
NOTE 7. COMMITMENTS AND CONTINGENCIES (CONTINUED)
Litigation
In the normal course of business, the Company may be subject to various legal proceedings and claims. The Company’s management is not aware of any threatened claim or potential liability that could materially affect its financial condition.
NOTE 8. SUBSEQUENT EVENTS
Management has evaluated all subsequent events through January 19, 2018 the date on which the financial statements were available to be issued.
In September 2016, the Company merged into Institute for Wealth Holdings, Inc. Beginning October 1, 2016, the financial results of institute for Wealth Management, LLC will be consolidated with its parent, Institute for Wealth Holdings, Inc.
On March 1, 2017, The Institute for Wealth Management, LLC entered into the Third Amendment to Lease Agreement with U.S. Premier Office Equities, L.P. for its office space. This agreement extends the commercial lease from March 1, 2017 to May 31, 2020. Total minimum rental commitments at December 31, 2016 are as follows:
| Year |
Denver, CO Office Space |
|||
| 2017 |
$ | 35,401 | ||
| 2018 |
84,601 | |||
| 2019 |
86,273 | |||
| Thereafter |
36,238 | |||
|
|
|
|||
| Total |
$ | 242,513 | ||
|
|
|
|||
In December 2017, Institute for Wealth Management Holdings, Inc. was dissolved as it no longer served its purpose.
84
Table of Contents
INSTITUTE FOR WEALTH MANAGEMENT HOLDINGS, INC.
CONSOLIDATED BALANCE SHEET - UNAUDITED
As of December 31, 2015
| December 31, | ||||
| 2015 | ||||
| ASSETS | ||||
| Current Assets: |
||||
| Cash and cash equivalents |
$ | 155,572 | ||
| Accounts receivable, net |
17,202 | |||
| Prepaid expenses |
9,546 | |||
| Deferred tax asset, current portion |
56,505 | |||
|
|
|
|||
| Total Current Assets |
238,825 | |||
|
|
|
|||
| Property, Equipment and Software, net |
12,534 | |||
| Other Assets: |
||||
| Other intangible assets net of amortization |
409 | |||
| Deferred tax asset, noncurrent portion |
1,195,487 | |||
|
|
|
|||
| Total Other Assets |
1,195,896 | |||
|
|
|
|||
| Total Assets |
$ | 1,447,255 | ||
|
|
|
|||
| December 31 | ||||
| 2015 | ||||
| LIABILITIES | ||||
| Current Liabilities: |
||||
| Line of credit |
$ | 87,079 | ||
| Accounts payable and accrued expenses |
50,158 | |||
| Accrued interest |
— | |||
|
|
|
|||
| Total Current Liabilities |
137,237 | |||
|
|
|
|||
| Long-Term Liabilities: |
||||
| Employee health benefits payable |
46,981 | |||
| Deferred compensation |
1,974,044 | |||
| Notes payable |
1,085,226 | |||
|
|
|
|||
| Total Long-Term Liabilities |
3,106,251 | |||
|
|
|
|||
| Total Liabilities |
$ | 3,243,488 | ||
|
|
|
|||
| STOCKHOLDERS’ EQUITY (DEFICIT) | ||||
| Stockholders’ Equity (Deficit): |
||||
| Series A Convertible preferred stock - par value $0.0001; |
$ | 83 | ||
| 10,000,000 shares issued and 1,189,286 shares outstanding |
||||
| Common stock - par value $0.0001; |
10 | |||
| 10,000,000 shares issued and 220,489 shares outstanding |
||||
| Additional paid in capital |
999,909 | |||
| Retained earnings |
(2,796,235 | ) | ||
|
|
|
|||
| Total Stockholders’ Equity (Deficit) |
(1,796,233 | ) | ||
|
|
|
|||
| Total Liabilities and Stockholders’ Equity (Deficit) |
$ | 1,447,255 | ||
|
|
|
|||
Summary of Significant Accounting Policies
| 1. | This balance sheet represents the financial position of IWMH and is presented exclusively of IWH. |
85
Table of Contents
INSTITUTE FOR WEALTH MANAGEMENT HOLDINGS, INC.
CONSOLIDATED STATEMENT OF OPERATIONS - UNAUDITED
For Year Ended December 31, 2015
| For Year Ended | ||||
| December 31, 2015 | ||||
| Revenue: |
||||
| Investment management (IWM) |
$ | 329,920 | ||
| Investment advisory (IWA) |
2,082,093 | |||
| Subadvisory |
119,916 | |||
| 401(k) advisory |
11,388 | |||
|
|
|
|||
| Total Revenue |
2,543,317 | |||
|
|
|
|||
| Cost of Revenue: |
||||
| Fees paid to IAR’s (IWM and IWA) |
1,262,541 | |||
| Fees paid to third party firms |
33,046 | |||
|
|
|
|||
| Total Cost of Revenue |
1,295,587 | |||
|
|
|
|||
| Gross Profit: |
1,247,730 | |||
| Operating Expenses: |
||||
| General and administrative |
112,789 | |||
| Salary and benefits |
724,061 | |||
| Rent and maintenance |
84,189 | |||
| Advertising and marketing |
79,630 | |||
| Technology and data subscriptions |
49,765 | |||
| Legal and professional |
88,698 | |||
|
|
|
|||
| Total Operating Expenses |
1,139,132 | |||
|
|
|
|||
| Net Operating Income (Loss) |
108,598 | |||
| Non Operating Income: |
||||
| Interest income |
5 | |||
| Gain from debt settlement |
— | |||
|
|
|
|||
| Total Non Operating Income: |
5 | |||
| Non Operating Expenses: |
||||
| Depreciation and amortization |
7,481 | |||
| Interest expense |
256,214 | |||
| Mergers and acquisitions |
— | |||
|
|
|
|||
| Total Non Operating Expenses: |
263,695 | |||
|
|
|
|||
| Net Income (Loss) Before Income Tax Expense |
(155,092 | ) | ||
|
|
|
|||
| Income Tax Expense |
4,683 | |||
|
|
|
|||
| Net Loss |
$ | (159,775 | ) | |
|
|
|
|||
Summary of Significant Accounting Policies
| 1. | This statement of operations represents the financial results of IWMH and is presented exclusively of IWH. |
86
Table of Contents
INSTITUTE FOR WEALTH MANAGEMENT HOLDINGS, INC.
CONSOLIDATED STATEMENT OF STOCKHOLDERS’ EQUITY (DEFICIT) - UNAUDITED
As of December 31, 2015
| Additional | ||||||||||||||||||||||||||||
| Preferred Stock | Common Stock | Paid-In | Retained | |||||||||||||||||||||||||
| Shares | Amount | Shares | Amount | Capital | Earnings | Total | ||||||||||||||||||||||
| Balance at December 31, 2014 |
839,286 | $ | 83 | 25,000 | $ | 3 | $ | 749,916 | $ | (2,636,460 | ) | $ | (1,886,458 | ) | ||||||||||||||
|
|
|
|
|
|
|
|
|
|
|
|
|
|
|
|||||||||||||||
| Preferred stock issued |
350,000 | — | — | — | — | — | — | |||||||||||||||||||||
| Common stock issued |
— | — | 195,489 | 7 | 249,993 | — | 250,000 | |||||||||||||||||||||
| Net loss |
— | — | — | — | — | (159,775 | ) | (159,775 | ) | |||||||||||||||||||
|
|
|
|
|
|
|
|
|
|
|
|
|
|
|
|||||||||||||||
| Balance at December 31, 2015 |
1,189,286 | $ | 83 | 220,489 | $ | 10 | $ | 999,909 | $ | (2,796,235 | ) | $ | (1,796,233 | ) | ||||||||||||||
|
|
|
|
|
|
|
|
|
|
|
|
|
|
|
|||||||||||||||
Summary of Significant Accounting Policies
| 1. | This statement of stockholders’ equity (deficit) represents the financial position of IWMH and is presented exclusively of IWH. |
87
Table of Contents
INSTITUTE FOR WEALTH MANAGEMENT HOLDINGS, INC.
CONSOLIDATED STATEMENT OF CASH FLOWS - UNAUDITED
For Year Ended December 31, 2015
| For Year Ended | ||||
| December 31, 2015 | ||||
| Cash Flows from Operating Activities: |
||||
| Net loss |
$ | (159,775 | ) | |
| Adjustments to reconcile net income (loss) to net cash provided by (used in) operating activities: |
||||
| Depreciation and amortization |
7,481 | |||
| Increase (decrease) in: |
||||
| Accounts receivable |
33,112 | |||
| Prepaid expenses |
8,046 | |||
| Deferred tax Asset |
4,546 | |||
| Accounts payable and accrued expenses |
(88,214 | ) | ||
|
|
|
|||
| Net Cash Provided by Operating Activities |
(194,804 | ) | ||
|
|
|
|||
| Cash Flows from Investing Activities: |
||||
|
|
|
|||
| Net Cash Used in Investing Activities |
— | |||
|
|
|
|||
| Cash Flows from Financing Activities: |
||||
| Net change in notes payable |
(27,264 | ) | ||
| Deferred compensation |
121,158 | |||
| Issuance (purchase) of common stock, par value |
7 | |||
| Additions to paid in capital |
249,993 | |||
|
|
|
|||
| Net Cash Used in Financing Activities |
343,894 | |||
|
|
|
|||
| Net Increase (Decrease) in Cash and Cash Equivalents |
149,090 | |||
| Cash and Cash Equivalents, beginning of year |
6,482 | |||
|
|
|
|||
| Cash and Cash Equivalents, end of year |
$ | 155,572 | ||
|
|
|
|||
| Supplemental Cash Flow Information: |
||||
| Interest paid |
$ | 83,357 | ||
|
|
|
|||
Summary of Significant Accounting Policies
| 1. | This statement of cash flows represents the financial results of IWMH and is presented exclusively of IWH. |
| 2. | Change is cash flow references periods from December 31, 2014 through December 31, 2015. |
88
Table of Contents
INSTITUTE FOR WEALTH MANAGEMENT HOLDINGS, INC.
NOTES TO CONSOLIDATED FINANCIAL STATEMENTS - UNAUDITED
For Year Ended December 31, 2015
NOTE 1. SUMMARY OF ACCOUNTING POLICIES
Description of Business
Institute for Wealth Management Holdings, Inc. (the “Company”) through its wholly owned subsidiary, Institute for Wealth Management, LLC (“IWM”), performs investment advisory, portfolio management, and administrative services, and currently acts as an investment advisor or subadvisor to various individuals, institutions, and mutual funds.
Principles of Consolidation
The accompanying consolidated financial statements present the consolidated financial position, results of operations and cash flows of the Company and its subsidiary. Significant intercompany balances and transactions have been eliminated.
Basis of Presentation
The accompanying consolidated financial statements have been prepared in conformity with U.S. generally accepted accounting principles (“GAAP”).
Basis of Accounting
The consolidated financial statements of the Company are prepared on the accrual basis of accounting. The accompanying consolidated financial statements include the accounts of the Company and its wholly owned subsidiaries. All material intercompany accounts and transactions have been eliminated in consolidation.
Use of Estimates
The accompanying consolidated financial statements have been prepared in accordance with accounting principles generally accepted in the United States of America that require management to make estimates and assumptions that affect the reported amounts of assets and liabilities, the disclosure of contingent assets and liabilities, the reported amount of revenues and expenses during the reporting period, as well as the accompanying notes. These estimates are based on information available to the Company. Actual results could differ from these estimates.
Cash and Cash Equivalents
For cash flow purposes, the Company considers cash and temporary investments with original maturities of three months or less to be cash and cash equivalents. The Company evaluates the creditworthiness of the financial institutions with which it invests in determining the risk associated with these deposits.
Accounts Receivable
The Company records accounts receivable in the normal course of business. The Company periodically evaluates the collectability of receivables and considers a reserve for doubtful accounts based on the creditworthiness of the customer. When identified, uncollectible accounts are first charged against the reserve to the extent available, then to operations. Historically, losses from uncollectible accounts have not been significant, and management has determined that no allowance is necessary as of December 31, 2015.
Property and Equipment
Property and equipment is stated at cost and depreciated using straight-line methods over the estimated useful lives ranging from three to seven years. Expenditures for repairs and maintenance are expensed when paid.
89
Table of Contents
INSTITUTE FOR WEALTH MANAGEMENT HOLDINGS, INC.
NOTES TO CONSOLIDATED FINANCIAL STATEMENTS - UNAUDITED
For Year Ended December 31, 2015
NOTE 1. SUMMARY OF ACCOUNTING POLICIES (CONTINUED)
Revenue Recognition
Retail product advisement revenues are computed under separate agreements between the Company and various clients for which it acts as an advisor or subadvisor. These fees are generally based on the market value of the assets under management. Advisory fees are recognized as revenue as services are performed. Certain advisory fees are presented net of expense reimbursements, customer refunds and shareholder servicing fees.
The Company provides various sub-advisory services for clients. These fees are generally based on the market value of the assets under management. Sub-advisory fees are recognized as revenue during the period such services are performed and are presented net of expense reimbursements, customer refunds and shareholder servicing fees.
Advertising and Marketing
Advertising and marketing costs are expensed as incurred. Advertising and marketing costs were $79,630 for the year ended December 31, 2015.
Income Taxes
Income taxes are provided for the tax effects of transactions reported in the financial statements and consist of taxes currently due plus deferred taxes related primarily to differences between the basis of certain assets and liabilities for financial and tax reporting. The deferred taxes represent the future tax return consequences of those differences, which will either be taxable or deductible when the assets and liabilities are recovered or settled. Deferred tax assets are limited to amounts considered to be realizable in future periods.
NOTE 2. DEFERRED COMPENSATION
During 2003, the Company entered into an agreement with their manager to defer annual compensation to future years. Under the terms of the agreement, any compensation deferred into future years accrues interest at an annual rate of 8% on the unpaid portion of the deferred compensation. The balance outstanding as of December 31, 2015 is $1,974,044.
NOTE 3. INCOME TAXES
As of December 31, 2015, the Company had Federal net operating loss carryforwards of approximately $384,367. If such net operating loss carryforwards are not utilized, the federal net operating loss carryforwards will begin to expire in 2026.
NOTE 4. NOTES PAYABLE
Notes Payable
The Company has various notes payable to individuals with interest rates ranging from 7.5% - 12% per year and a default rate of interest of 9% - 14% per year. These notes have various dates of maturities, which have been extended and/or waived by agreement with parties. The notes payable balance as of December 31, 2015 was $1,085,226.
Line of Credit
The Company has a $100,000 working capital line of credit with a financial institution with no stated maturity date. Interest is payable monthly at prime plus 1% (4.50% at December 31, 2015). The line is collateralized by all of the equipment and assets of the Company and guaranteed by the Company’s manager. Outstanding borrowings under the agreement at December 31, 2015 amounted to $87,079.
90
Table of Contents
INSTITUTE FOR WEALTH MANAGEMENT HOLDINGS, INC.
NOTES TO CONSOLIDATED FINANCIAL STATEMENTS - UNAUDITED
For Year Ended December 31, 2015
NOTE 5. STOCKHOLDERS’ EQUITY
Preferred Stock
Preferred Stock includes the Company’s designated Series A Convertible Preferred Stock (the “Preferred Stock”). The Company had 10,000,000 shares of Preferred Stock authorized at $0.0001 par value.
Preferred Stockholders shall be entitled to the number of votes equal to the number of whole shares of Common Stock into which the shares of Preferred Stock are convertible. Preferred Stockholders are entitled, at any time, to convert their shares into fully paid and non-assessable shares of Common Stock. The number of shares of Common Stock to which a holder of Preferred Stock can convert is obtained by multiplying the conversion rate that is in effect by the number of shares of Preferred Stock being converted. The conversion rate is determined by dividing the original issue price by the applicable conversion price. Preferred Stockholders are only entitled to receive cash dividends to the extent they are paid to Common Stockholders, in which case they will receive them on as as-if-converted basis.
Dividends are payable only when and if declared by the Board of Directors. In accordance with the Articles of Incorporation, upon any event of liquidation, dissolution, or winding up of the Company, any amounts that are available for distributions to its stockholders to be paid out of the assets of the Company are paid first to Preferred Stockholders in an amount per share of Preferred Stock equal to the greater of the original issue price of $2.00 per share plus declared and unpaid dividends or such amount as would have been received had each Preferred Stock share been converted into shares of Common Stock immediately prior to such liquidation.
After the payment of the full liquidation preference of Preferred Stock, the remaining assets of the Company legally available for distribution are to be distributed ratably to the holders of Common Stock. However, a Preferred Stockholder is entitled to receive, on a pro rata basis, the greater of the amount of cash, securities, or other property the Preferred Stockholder would be entitled to receive in a liquidation event if the Preferred Stock shares had been converted to Common Stock immediately prior to the acquisition or asset transfer.
Stock Options
In October 2006, the Company granted 150,000 Common Stock options to an officer of the Company. These options were exercised in 2015.
In February 2004, the Company granted 125,000 Common Stock options to an officer of the Company. These options were exercised in 2015.
NOTE 6. RELATED PARTY TRANSACTION
The company has several notes payable to shareholders. As of December 31, 2015, the outstanding balances due to related parties as holders of the notes were $1,085,226, described in Note 4.
NOTE 7. COMMITMENTS AND CONTINGENCIES
Litigation
In the normal course of business, the Company may be subject to various legal proceedings and claims. The Company’s management is not aware of any threatened claim or potential liability that could materially affect its financial condition.
91
Table of Contents
INSTITUTE FOR WEALTH MANAGEMENT HOLDINGS, INC.
NOTES TO CONSOLIDATED FINANCIAL STATEMENTS - UNAUDITED
For Year Ended December 31, 2015
NOTE 7. COMMITMENTS AND CONTINGENCIES (CONTINUED)
Operating Leases
The Company leases facilities under a non-cancelable operating lease. Rent expense for the nine months ended December 31, 2015 was $71,800.
Future minimum lease payments under this lease are as follows:
| Year |
Denver, CO |
|||
| 2016 |
$ | 73,590 | ||
| 2017 |
12,265 | |||
| 2018 |
— | |||
| Thereafter |
— | |||
|
|
|
|||
| Total |
$ | 85,855 | ||
|
|
|
|||
NOTE 8. SUBSEQUENT EVENTS
Management has evaluated all subsequent events through January 19, 2018 the date on which the financial statements were available to be issued.
In September 2016, the Company merged into Institute for Wealth Holdings, Inc. Beginning October 1, 2016, the financial results of institute for Wealth Management, LLC will be consolidated with its parent, Institute for Wealth Holdings, Inc.
On March 1, 2017, The Institute for Wealth Management, LLC entered into the Third Amendment to Lease Agreement with U.S. Premier Office Equities, L.P. for its office space. This agreement extends the commercial lease from March 1, 2017 to May 31, 2020. There were no minimum rental commitments at December 31, 2015 for this agreement.
In December 2017, Institute for Wealth Management Holdings, Inc. was dissolved as it no longer served its purpose.
92
Table of Contents
SUPPLEMENTAL INFORMATION – UNAUDITED
INSTITUTE FOR WEALTH HOLDINGS, INC.
Balance Sheets and Statements of Operations (Pro Forma)
For Years Ended December 31, 2016 and 2015
93
Table of Contents
INSTITUTE FOR WEALTH HOLDINGS, INC.
INSTITUTE FOR WEALTH MANAGEMENT HOLDINGS, INC.
BALANCE SHEETS (PRO FORMA) - UNAUDITED
As of December 31, 2016
| December 31, 2016 | ||||||||||||||||||
| IWH | IWMH | Adjustments | Consolidated | |||||||||||||||
| ASSETS | ||||||||||||||||||
| Current Assets: |
||||||||||||||||||
| Cash and cash equivalents |
$ | 20,674 | $ | 16,817 | $ | 37,491 | ||||||||||||
| Accounts receivable, net |
25,551 | 16,111 | 41,662 | |||||||||||||||
| Prepaid expenses |
12,123 | 8,265 | 20,388 | |||||||||||||||
| Deferred tax asset, current portion |
(56,690 | ) | 56,690 | — | ||||||||||||||
|
|
|
|
|
|
|
|||||||||||||
| Total Current Assets |
1,658 | 97,883 | 99,541 | |||||||||||||||
|
|
|
|
|
|
|
|||||||||||||
| Property, Equipment and Software, net |
3,378 | 7,240 | 10,618 | |||||||||||||||
| Other Assets: |
||||||||||||||||||
| Other intangible assets net of amortization |
— | 10,037 | 10,037 | |||||||||||||||
| Deferred tax asset, noncurrent portion |
680,216 | 1,195,302 | 1,875,518 | |||||||||||||||
| Goodwill, net |
— | — | (a) | 3,077,459 | 3,077,459 | |||||||||||||
|
|
|
|
|
|
|
|||||||||||||
| Total Other Assets |
680,216 | 1,205,339 | 4,963,014 | |||||||||||||||
|
|
|
|
|
|
|
|||||||||||||
| Total Assets |
$ | 685,252 | $ | 1,310,462 | $ | 5,073,173 | ||||||||||||
|
|
|
|
|
|
|
|||||||||||||
| December 31, 2016 | ||||||||||||||||||
| IWH | IWMH | Adjustments | Consolidated | |||||||||||||||
| LIABILITIES | ||||||||||||||||||
| Current Liabilities: |
||||||||||||||||||
| Line of credit |
$ | — | $ | 87,079 | $ | 87,079 | ||||||||||||
| Accounts payable and accrued expenses |
111,190 | 114,205 | 225,395 | |||||||||||||||
| Accrued interest |
163,738 | — | 163,738 | |||||||||||||||
|
|
|
|
|
|
|
|||||||||||||
| Total Current Liabilities |
274,928 | 201,284 | 476,212 | |||||||||||||||
|
|
|
|
|
|
|
|||||||||||||
| Long-Term Liabilities: |
||||||||||||||||||
| Employee health benefits payable |
— | 46,656 | 46,656 | |||||||||||||||
| Deferred compensation |
100,000 | 832,903 | 932,903 | |||||||||||||||
| Notes payable |
2,399,243 | 474,935 | 2,874,178 | |||||||||||||||
|
|
|
|
|
|
|
|||||||||||||
| Total Long-Term Liabilities |
2,499,243 | 1,354,494 | 3,853,737 | |||||||||||||||
|
|
|
|
|
|
|
|||||||||||||
| Total Liabilities |
$ | 2,774,171 | $ | 1,555,778 | $ | 4,329,949 | ||||||||||||
|
|
|
|
|
|
|
|||||||||||||
| STOCKHOLDERS’ EQUITY (DEFICIT) | ||||||||||||||||||
| Stockholders’ Equity (Deficit): |
||||||||||||||||||
| Series B Convertible preferred stock - par value $0.001 |
$ | 591,800 | $ | 83 | (a) | $ | (83 | ) | $ | 591,800 | ||||||||
| Series C Convertible preferred stock - par value $0.001 |
— | — | (a) | 1,836,828 | 1,836,828 | |||||||||||||
| Common stock, par value $0.001 |
2,326 | 10 | (a) | 343 | 2,679 | |||||||||||||
| Common stock additional paid-in capital |
249,314 | — | (a) | 340,190 | 589,504 | |||||||||||||
| Additional paid in capital |
(820,000 | ) | 1,819,909 | (a) | (999,909 | ) | — | |||||||||||
| Retained earnings |
(2,112,359 | ) | (2,065,318 | ) | (a) | 1,900,090 | (2,277,587 | ) | ||||||||||
|
|
|
|
|
|
|
|||||||||||||
| Total Stockholders’ Equity (Deficit) |
(2,088,919 | ) | (245,316 | ) | 743,224 | |||||||||||||
|
|
|
|
|
|
|
|||||||||||||
| Total Liabilities and Stockholders’ Equity (Deficit) |
$ | 685,252 | $ | 1,310,462 | $ | 5,073,173 | ||||||||||||
|
|
|
|
|
|
|
|||||||||||||
Summary of Significant Accounting Policies
| 1. | These balance sheets represent the financial position of IWH and IWMH in a consolidated format. |
Adjustments:
| (a) | Transactions from merger of IWMH into IWH. |
94
Table of Contents
INSTITUTE FOR WEALTH HOLDINGS, INC.
INSTITUTE FOR WEALTH MANAGEMENT HOLDINGS, INC.
BALANCE SHEETS (PRO FORMA) - UNAUDITED
As of December 31, 2015
| December 31, 2015 | ||||||||||||
| IWH | IWMH | Combined | ||||||||||
| ASSETS | ||||||||||||
| Current Assets: |
||||||||||||
| Cash and cash equivalents |
$ | 10,223 | $ | 155,572 | $ | 165,795 | ||||||
| Accounts receivable, net |
34,044 | 17,202 | 51,246 | |||||||||
| Prepaid expenses |
3,633 | 9,546 | 13,179 | |||||||||
| Deferred tax asset, current portion |
— | 56,505 | 56,505 | |||||||||
|
|
|
|
|
|
|
|||||||
| Total Current Assets |
47,900 | 238,825 | 286,725 | |||||||||
|
|
|
|
|
|
|
|||||||
| Property, Equipment and Software, net |
2,446 | 12,534 | 14,980 | |||||||||
| Other Assets: |
||||||||||||
| Other intangible assets net of amortization |
— | 409 | 409 | |||||||||
| Deferred tax asset, noncurrent portion |
619,722 | 1,195,487 | 1,815,209 | |||||||||
|
|
|
|
|
|
|
|||||||
| Total Other Assets |
619,722 | 1,195,896 | 1,815,618 | |||||||||
|
|
|
|
|
|
|
|||||||
| Total Assets |
$ | 670,068 | $ | 1,447,255 | $ | 2,117,323 | ||||||
|
|
|
|
|
|
|
|||||||
| December 31, 2015 | ||||||||||||
| IWH | IWMH | Combined | ||||||||||
| LIABILITIES | ||||||||||||
| Current Liabilities: |
||||||||||||
| Line of credit |
$ | — | $ | 87,079 | $ | 87,079 | ||||||
| Accounts payable and accrued expenses |
113,606 | 50,158 | 163,764 | |||||||||
| Accrued interest |
138,625 | — | 138,625 | |||||||||
|
|
|
|
|
|
|
|||||||
| Total Current Liabilities |
252,231 | 137,237 | 389,468 | |||||||||
|
|
|
|
|
|
|
|||||||
| Long-Term Liabilities: |
||||||||||||
| Employee health benefits payable |
— | 46,981 | 46,981 | |||||||||
| Deferred compensation |
397,222 | 1,974,044 | 2,371,266 | |||||||||
| Notes payable |
648,828 | 1,085,226 | 1,734,054 | |||||||||
|
|
|
|
|
|
|
|||||||
| Total Long-Term Liabilities |
1,046,050 | 3,106,251 | 4,152,301 | |||||||||
|
|
|
|
|
|
|
|||||||
| Total Liabilities |
$ | 1,298,281 | $ | 3,243,488 | $ | 4,541,769 | ||||||
|
|
|
|
|
|
|
|||||||
| STOCKHOLDERS’ EQUITY (DEFICIT) | ||||||||||||
| Stockholders’ Equity (Deficit): |
||||||||||||
| Series A Convertible preferred stock - par value $0.001 |
$ | 30,000 | $ | — | $ | 30,000 | ||||||
| Series B Convertible preferred stock - par value $0.001 |
606,800 | 83 | 606,883 | |||||||||
| Series C Convertible preferred stock - par value $0.001 |
2,083 | — | 2,083 | |||||||||
| Common stock, par value $0.001 |
— | 10 | 10 | |||||||||
| Common stock additional paid-in capital |
248,211 | — | 248,211 | |||||||||
| Additional paid in capital |
— | 999,909 | 999,909 | |||||||||
| Retained earnings |
(1,515,307 | ) | (2,796,235 | ) | (4,311,542 | ) | ||||||
|
|
|
|
|
|
|
|||||||
| Total Stockholders’ Equity (Deficit) |
(628,213 | ) | (1,796,233 | ) | (2,424,446 | ) | ||||||
|
|
|
|
|
|
|
|||||||
| Total Liabilities and Stockholders’ Equity (Deficit) |
$ | 670,068 | $ | 1,447,255 | $ | 2,117,323 | ||||||
|
|
|
|
|
|
|
|||||||
Summary of Significant Accounting Policies
| 1. | These balance sheets represent the financial position of IWH and IWMH in a combined format. |
95
Table of Contents
INSTITUTE FOR WEALTH HOLDINGS, INC.
INSTITUTE FOR WEALTH MANAGEMENT HOLDINGS, INC.
STATEMENTS OF OPERATIONS (PRO FORMA) - UNAUDITED
For the Years Ended December 31, 2016
| Year Ended December 31, 2016 | ||||||||||||||||
| IWH | IWMH | Adjustments | Consolidated | |||||||||||||
| Revenue |
||||||||||||||||
| Investment management (IWM) |
$ | — | $ | 221,487 | $ | 221,487 | ||||||||||
| Investment advisory (IWA & IWM) |
495,839 | 1,429,376 | 1,925,215 | |||||||||||||
| Subadvisory |
— | 80,241 | 80,241 | |||||||||||||
| 401(k) advisory |
— | 9,523 | 9,523 | |||||||||||||
| Life & annuity (IL&A) |
92,376 | — | 92,376 | |||||||||||||
| Advisor services (IWP) |
14,903 | — | 14,903 | |||||||||||||
|
|
|
|
|
|
|
|||||||||||
| Total Revenue |
603,118 | 1,740,627 | 2,343,745 | |||||||||||||
|
|
|
|
|
|
|
|||||||||||
| Cost of Revenue: |
||||||||||||||||
| Fees paid to IAR’s (IWM and IWA) |
388,266 | 866,391 | 1,254,657 | |||||||||||||
| Fees paid to third party firms |
— | 47,903 | 47,903 | |||||||||||||
| Commissions to agents (ILA) |
99,880 | — | 99,880 | |||||||||||||
|
|
|
|
|
|
|
|||||||||||
| Total Cost of Sales |
488,146 | 914,294 | 1,402,440 | |||||||||||||
|
|
|
|
|
|
|
|||||||||||
| Gross Profit: |
114,972 | 826,333 | 941,305 | |||||||||||||
| Operating Expenses: |
||||||||||||||||
| General and administrative |
39,004 | 104,273 | 143,277 | |||||||||||||
| Salary and benefits |
125,344 | 796,846 | 922,190 | |||||||||||||
| Rent and maintenance |
54,234 | 85,348 | 139,582 | |||||||||||||
| Advertising and marketing |
59,761 | 41,446 | 101,207 | |||||||||||||
| Technology and data subscriptions |
23,165 | 64,685 | 87,850 | |||||||||||||
| Legal and professional |
11,067 | 109,890 | 120,957 | |||||||||||||
|
|
|
|
|
|
|
|||||||||||
| Total Operating Expenses |
312,575 | 1,202,488 | 1,515,063 | |||||||||||||
|
|
|
|
|
|
|
|||||||||||
| Net Operating Income (Loss) |
(197,603 | ) | (376,155 | ) | (573,758 | ) | ||||||||||
| Non Operating Income: |
||||||||||||||||
| Interest income |
||||||||||||||||
| Gain from debt settlement |
385,016 | 1,329,324 | 1,714,340 | |||||||||||||
|
|
|
|
|
|
|
|||||||||||
| Total Non Operating Income: |
385,016 | 1,329,324 | 1,714,340 | |||||||||||||
| Non Operating Expenses: |
||||||||||||||||
| Depreciation and amortization |
1,184 | 7,016 | 8,200 | |||||||||||||
| Interest expense |
81,876 | 208,124 | 290,000 | |||||||||||||
| Mergers and acquisitions |
705,210 | 7,111 | 712,321 | |||||||||||||
|
|
|
|
|
|
|
|||||||||||
| Total Non Operating Expenses: |
788,270 | 222,251 | 1,010,521 | |||||||||||||
|
|
|
|
|
|
|
|||||||||||
| Net Income (Loss) Before Income Tax Expense |
(600,857 | ) | 730,918 | 130,061 | ||||||||||||
|
|
|
|
|
|
|
|||||||||||
| Income Tax Expense |
(3,804 | ) | — | (3,804 | ) | |||||||||||
|
|
|
|
|
|
|
|||||||||||
| Net Income (Loss) |
$ | (597,053 | ) | $ | 730,918 | $ | 133,865 | |||||||||
|
|
|
|
|
|
|
|||||||||||
Summary of Significant Accounting Policies
| 1. | These statements of operations represent the financial results of IWH and IWMH in a consolidated format. |
96
Table of Contents
INSTITUTE FOR WEALTH HOLDINGS, INC.
INSTITUTE FOR WEALTH MANAGEMENT HOLDINGS, INC.
STATEMENTS OF OPERATIONS (PRO FORMA) - UNAUDITED
For the Years Ended December 31, 2015
| Year Ended December 31, 2015 | ||||||||||||
| IWH | IWMH | Combined | ||||||||||
| Revenue |
||||||||||||
| Investment management (IWM) |
$ | — | $ | 329,919 | $ | 329,919 | ||||||
| Investment advisory (IWA & IWM) |
454,679 | 2,082,093 | 2,536,772 | |||||||||
| Subadvisory |
— | 119,916 | 119,916 | |||||||||
| 401(k) advisory |
— | 11,388 | 11,388 | |||||||||
| Life & annuity (IL&A) |
198,605 | — | 198,605 | |||||||||
| Advisor services (IWP) |
12,822 | — | 12,822 | |||||||||
|
|
|
|
|
|
|
|||||||
| Total Revenue |
666,106 | 2,543,316 | 3,209,422 | |||||||||
|
|
|
|
|
|
|
|||||||
| Cost of Revenue: |
||||||||||||
| Fees paid to IAR’s (IWM and IWA) |
354,010 | 1,262,541 | 1,616,551 | |||||||||
| Fees paid to third party firms |
— | 33,046 | 33,046 | |||||||||
| Commissions to agents (ILA) |
127,089 | — | 127,089 | |||||||||
|
|
|
|
|
|
|
|||||||
| Total Cost of Sales |
481,099 | 1,295,587 | 1,776,686 | |||||||||
|
|
|
|
|
|
|
|||||||
| Gross Profit: |
185,007 | 1,247,729 | 1,432,736 | |||||||||
| Operating Expenses: |
||||||||||||
| General and administrative |
21,736 | 113,284 | 135,020 | |||||||||
| Salary and benefits |
105,435 | 724,061 | 829,496 | |||||||||
| Rent and maintenance |
54,488 | 84,189 | 138,677 | |||||||||
| Advertising and marketing |
30,366 | 79,130 | 109,496 | |||||||||
| Technology and data subscriptions |
14,253 | 49,765 | 64,018 | |||||||||
| Legal and professional |
10,867 | 88,698 | 99,565 | |||||||||
|
|
|
|
|
|
|
|||||||
| Total Operating Expenses |
237,145 | 1,139,127 | 1,376,272 | |||||||||
|
|
|
|
|
|
|
|||||||
| Net Operating Income (Loss) |
(52,138 | ) | 108,602 | 56,464 | ||||||||
| Non Operating Income: |
||||||||||||
| Interest income |
||||||||||||
| Gain from debt settlement |
226,478 | — | 226,478 | |||||||||
|
|
|
|
|
|
|
|||||||
| Total Non Operating Income: |
226,478 | — | 226,478 | |||||||||
| Non Operating Expenses: |
||||||||||||
| Depreciation and amortization |
1,164 | 7,481 | 8,645 | |||||||||
| Interest expense |
24,280 | 256,213 | 280,493 | |||||||||
| Mergers and acquisitions |
— | — | — | |||||||||
|
|
|
|
|
|
|
|||||||
| Total Non Operating Expenses: |
25,444 | 263,694 | 289,138 | |||||||||
|
|
|
|
|
|
|
|||||||
| Net Income (Loss) Before Income Tax Expense |
148,896 | (155,092 | ) | (6,196 | ) | |||||||
|
|
|
|
|
|
|
|||||||
| Income Tax Expense |
31,610 | 4,683 | 36,293 | |||||||||
|
|
|
|
|
|
|
|||||||
| Net Income (Loss) |
$ | 117,286 | $ | (159,775 | ) | $ | (42,489 | ) | ||||
|
|
|
|
|
|
|
|||||||
Summary of Significant Accounting Policies
| 1. | These statements of operations represent the financial results of IWH and IWMH in a combined format. |
97
Table of Contents
INSTITUTE FOR WEALTH HOLDINGS, INC.
Financial Statements –Unaudited
For Interim Period Ending September 30, 2017 and 2016
98
Table of Contents
INSTITUTE FOR WEALTH HOLDINGS, INC.
CONSOLIDATED BALANCE SHEET - UNAUDITED
As of September 30, 2017 and 2016
| September 30, 2017 | September 30, 2016 | |||||||
| ASSETS |
||||||||
| Cash and cash equivalents |
$ | 6,126 | $ | 92,721 | ||||
| Accounts Receivable, net |
100,757 | 40 | ||||||
| Prepaid expenses |
66,173 | 5,214 | ||||||
| Deposits |
7,248 | — | ||||||
|
|
|
|
|
|||||
| Total Current Assets |
180,304 | 97,974 | ||||||
|
|
|
|
|
|||||
| Property, Equipment and Software, net |
6,638 | 2,194 | ||||||
| Other Assets: |
||||||||
| Other intangible assets net of amortization |
9,163 | — | ||||||
| Deferred tax assets, noncurrent portion |
1,875,518 | 619,722 | ||||||
| Goodwill |
3,077,459 | — | ||||||
|
|
|
|
|
|||||
| Total Other Assets |
4,962,141 | 619,722 | ||||||
|
|
|
|
|
|||||
| Total Assets |
$ | 5,149,083 | $ | 719,890 | ||||
|
|
|
|
|
|||||
| LIABILITIES |
||||||||
| Current Liabilities |
||||||||
| Line of credit |
$ | 87,079 | $ | — | ||||
| Accounts payable and accrued expenses |
605,409 | 199,060 | ||||||
| Accrued Interest |
210,665 | 175,643 | ||||||
| Accrued Compensation |
197,917 | — | ||||||
|
|
|
|
|
|||||
| Total Current Liabilities |
1,101,070 | 374,703 | ||||||
|
|
|
|
|
|||||
| Long-Term Liabilities |
||||||||
| Employee health benefits |
46,981 | — | ||||||
| Deferred compensation |
942,943 | 100,000 | ||||||
| Notes Payable |
2,945,113 | 2,210,993 | ||||||
|
|
|
|
|
|||||
| Total Long-Term Liabilities |
3,935,037 | 2,310,993 | ||||||
|
|
|
|
|
|||||
| Total Liabilities |
$ | 5,036,107 | $ | 2,685,697 | ||||
|
|
|
|
|
|||||
| STOCKHOLDERS’ EQUITY (DEFICIT) |
||||||||
| Stockholders’ Equity (Deficit) |
||||||||
| Series B Convertible preferred stock - par value $0.001 |
$ | 591,800 | 591,800 | |||||
| 70,000 Shares authorized: 59,180 issued and outstanding |
||||||||
| Series C Convertible preferred stock - par value $0.001 |
1,836,828 | — | ||||||
| Sept 30, 2017 1,925,000 Shares authorized: 1,904,404 issued and outstanding |
||||||||
| Sept 30, 2016 1,925,000 Shares authorized: 0 issued and outstanding |
||||||||
| Common Stock - par value $0.001 |
2,702 | 2,203 | ||||||
| Sept 30, 2017: 50,000,000 Shares authorized: 2,700,710 issued and outstanding |
||||||||
| Sept 30, 2016: 10,000,000 Shares authorized: 2,202,640 issued and outstanding |
||||||||
| Common Stock additional paid in capital |
589,706 | 248,211 | ||||||
| Membership Interest |
— | (820,000 | ) | |||||
| Retained Earnings |
(2,908,059 | ) | (1,988,020 | ) | ||||
|
|
|
|
|
|||||
| Total Stockholders’ Equity (deficit) |
112,976 | (1,965,806 | ) | |||||
|
|
|
|
|
|||||
| Total Liabilities and Stockholders’ Equity (deficit) |
$ | 5,149,083 | $ | 719,890 | ||||
|
|
|
|
|
|||||
The accompanying notes are an integral part of these financial statements.
99
Table of Contents
INSTITUTE FOR WEALTH HOLDINGS, INC.
CONSOLIDATED STATEMENT OF OPERATIONS - UNAUDITED
For the Nine Months Ended September 30, 2017 and 2016
| September 30, 2017 | September 30, 2016 | |||||||
| REVENUE |
||||||||
| Investment Management Revenue |
$ | 3,009,969 | $ | 342,768 | ||||
| Other Revenue |
203,657 | 86,103 | ||||||
|
|
|
|
|
|||||
| Total Revenue |
3,213,626 | 428,871 | ||||||
| COST OF REVENUE |
||||||||
| Fees Paid to IAR’s |
2,047,310 | 268,990 | ||||||
| Other Cost of Revenue |
128,586 | 82,647 | ||||||
|
|
|
|
|
|||||
| Total Cost of Revenue |
2,175,896 | 351,637 | ||||||
|
|
|
|
|
|||||
| Gross Profit |
1,037,730 | 77,234 | ||||||
| OPERATING EXPENSES |
||||||||
| General and Administrative |
97,633 | 31,236 | ||||||
| Salary and Benefits |
915,599 | 93,655 | ||||||
| Rent and Maintenance |
121,240 | 40,015 | ||||||
| Advertising and marketing |
60,621 | 15,405 | ||||||
| Technology and Data Subscriptions |
83,449 | 8,439 | ||||||
| Legal and Professional |
199,497 | 1,138 | ||||||
|
|
|
|
|
|||||
| Total Operating Expenses |
1,478,039 | 189,888 | ||||||
|
|
|
|
|
|||||
| Net Operating Income(Loss) |
$ | (440,309 | ) | $ | (112,654 | ) | ||
| NON- OPERATING INCOME |
||||||||
| Other Income |
2 | 385,017 | ||||||
| NON-OPERATING EXPENSES |
||||||||
| Depreciation and Amortization |
4,853 | 830 | ||||||
| Interest Expense |
149,276 | 39,037 | ||||||
| Merger & Acquisition Expenses |
36,037 | 705,210 | ||||||
|
|
|
|
|
|||||
| Total Non-Operating Expenses |
190,166 | 745,076 | ||||||
|
|
|
|
|
|||||
| Pre Tax Income (Loss) |
$ | (630,472 | ) | $ | (472,713 | ) | ||
| Provision For Income Taxes |
— | — | ||||||
|
|
|
|
|
|||||
| NET INCOME (LOSS) |
$ | (630,472 | ) | $ | (472,713 | ) | ||
|
|
|
|
|
|||||
The accompanying notes are an integral part of these financial statements.
100
Table of Contents
INSTITUTE FOR WEALTH HOLDINGS, INC.
CONSOLIDATED STATEMENT OF STOCKHOLDERS’ EQUITY (DEFICT) - UNAUDITED
As of September 30, 2017 and 2016
| Series A Preferred Stock |
Series B Preferred Stock |
Series C Preferred Stock |
Common Stock | Additional Paid-In |
Retained | |||||||||||||||||||||||||||||||||||||||
| Shares | Amount | Shares | Amount | Shares | Amount | Shares | Amount | Capital | Earnings | Total | ||||||||||||||||||||||||||||||||||
| Balance at December 31, 2015 |
3,000 | $ | 30,000 | 60,680 | $ | 606,800 | — | $ | — | 2,082,640 | $ | 2,083 | $ | 248,211 | $ | (1,515,307 | ) | $ | (628,213 | ) | ||||||||||||||||||||||||
|
|
|
|
|
|
|
|
|
|
|
|
|
|
|
|
|
|
|
|
|
|
|
|||||||||||||||||||||||
| Common stock issued |
— | — | — | — | — | 120,000 | 120 | — | — | 120 | ||||||||||||||||||||||||||||||||||
| Preferred Stock Retired |
(3,000 | ) | (30,000 | ) | (1,500 | ) | (15,000 | ) | — | — | — | — | — | (45,000 | ) | |||||||||||||||||||||||||||||
| Membership Interest |
(820,000 | ) | (820,000 | ) | ||||||||||||||||||||||||||||||||||||||||
| Net income (loss) |
— | — | — | — | — | — | — | (472,713 | ) | (472,713 | ) | |||||||||||||||||||||||||||||||||
|
|
|
|
|
|
|
|
|
|
|
|
|
|
|
|
|
|
|
|
|
|
|
|||||||||||||||||||||||
| Balance at September 30, 2016 |
— | — | 59,180 | $ | 591,800 | — | — | 2,202,640 | $ | 2,203 | $ | 248,211 | $ | (2,808,020 | ) | $ | (1,965,806 | ) | ||||||||||||||||||||||||||
|
|
|
|
|
|
|
|
|
|
|
|
|
|
|
|
|
|
|
|
|
|
|
|||||||||||||||||||||||
| Common stock issued |
— | — | — | — | — | — | — | — | — | — | ||||||||||||||||||||||||||||||||||
| Warrants Exercised |
— | — | — | — | — | 122,500 | 123 | 1,102 | — | 1,225 | ||||||||||||||||||||||||||||||||||
| Merger & Acquisition |
— | — | — | — | 1,904,404 | 1,836,828 | 353,070 | 353 | 340,191 | — | 2,177,372 | |||||||||||||||||||||||||||||||||
| Membership Interest |
820,000 | 820,000 | ||||||||||||||||||||||||||||||||||||||||||
| Net income (loss) |
— | — | — | — | — | — | — | (289,567 | ) | (289,567 | ) | |||||||||||||||||||||||||||||||||
|
|
|
|
|
|
|
|
|
|
|
|
|
|
|
|
|
|
|
|
|
|
|
|||||||||||||||||||||||
| Balance at December 31, 2016 |
— | — | 59,180 | $ | 591,800 | 1,904,404.00 | 1,836,828.00 | 2,678,210 | $ | 2,679 | $ | 589,504 | $ | (2,277,587 | ) | $ | 743,224 | |||||||||||||||||||||||||||
|
|
|
|
|
|
|
|
|
|
|
|
|
|
|
|
|
|
|
|
|
|
|
|||||||||||||||||||||||
| Common stock issued |
— | — | — | — | — | — | — | — | — | — | — | |||||||||||||||||||||||||||||||||
| Warrants Exercised |
— | — | — | — | — | — | 22,500 | 23 | 203 | — | 225 | |||||||||||||||||||||||||||||||||
| Net income (loss) |
— | — | — | — | — | — | — | — | — | (630,472 | ) | (630,472 | ) | |||||||||||||||||||||||||||||||
|
|
|
|
|
|
|
|
|
|
|
|
|
|
|
|
|
|
|
|
|
|
|
|||||||||||||||||||||||
| Balance at September 30, 2017 |
— | — | 59,180 | $ | 591,800 | 1,904,404.00 | 1,836,828.00 | 2,700,710 | $ | 2,702 | $ | 589,707 | $ | (2,908,059 | ) | $ | 112,977 | |||||||||||||||||||||||||||
|
|
|
|
|
|
|
|
|
|
|
|
|
|
|
|
|
|
|
|
|
|
|
|||||||||||||||||||||||
The accompanying notes are an integral part of these financial statements.
101
Table of Contents
INSTITUTE FOR WEALTH HOLDINGS, INC.
CONSOLIDATED STATEMENTS OF CASH FLOWS - UNAUDITED
For the Nine Months Ended September 30, 2017 and 2016
| September 30, 2017 | September 30, 2016 | |||||||
| Cash Flows from Operating Activities: |
||||||||
| Net Income/(Loss) |
$ | (630,472 | ) | $ | (472,713 | ) | ||
| Adjustments to reconcile net income (loss) to net cash provided by (used in) operating activities: |
||||||||
| Depreciation and amortization |
4,853 | 830 | ||||||
| Increase (decrease) in: |
||||||||
| Accounts receivable |
(59,095 | ) | 34,004 | |||||
| Deposits |
(7,248 | ) | — | |||||
| Prepaid expenses |
(45,784 | ) | (1,581 | ) | ||||
| Vendor Write Off |
— | (87,794 | ) | |||||
| Deferred tax asset |
— | — | ||||||
| Accounts payable and accrued expenses |
380,014 | 85,454 | ||||||
| Accrued Interest |
46,927 | 37,018 | ||||||
| Accrued compensation |
197,917 | (297,222 | ) | |||||
|
|
|
|
|
|||||
| Net Cash Provided by Operating Activities |
(112,889 | ) | (702,004 | ) | ||||
|
|
|
|
|
|||||
| Cash Flow from Investing Activities: |
||||||||
| Purchase of Fixed Assets |
— | (578 | ) | |||||
| Goodwill |
— | — | ||||||
|
|
|
|
|
|||||
| Net Cash Used in Financing Activities |
— | (578 | ) | |||||
|
|
|
|
|
|||||
| Cash Flow from Financing Activities: |
||||||||
| Net Change in Notes Payable |
71,259 | 1,649,959 | ||||||
| Deferred Compensation |
10,040 | — | ||||||
| Purchase of Preferred Stock - Series A |
— | (30,000 | ) | |||||
| Purchase of Preferred Stock - Series B |
— | (15,000 | ) | |||||
| Issuance of Preferred Stock - Series C |
— | — | ||||||
| Issuance (purchase) of common stock |
23 | 120 | ||||||
| Addition to paid in capital |
203 | — | ||||||
| Membership Adjustment |
— | (820,000 | ) | |||||
|
|
|
|
|
|||||
| Net Cash Used in Financing Activities |
81,524 | 785,079 | ||||||
|
|
|
|
|
|||||
| Net Increase (decrease) in Cash and Cash Equivalents |
(31,365 | ) | 82,497 | |||||
| Cash and Cash Equivalents, beginning of year |
37,491 | 10,223 | ||||||
|
|
|
|
|
|||||
| Cash and Cash Equivalents, end of period |
$ | 6,126 | $ | 92,721 | ||||
|
|
|
|
|
|||||
| Supplemental Cash Flow Information: |
||||||||
| Inerest Paid |
$ | 88,802 | $ | 53,338 | ||||
|
|
|
|
|
|||||
The accompanying notes are an integral part of these financial statements.
102
Table of Contents
NOTE 1. SUMMARY OF ACCOUNTING POLICIES
Description of Business and Basis of Presentation
The Institute for Wealth Holdings, Inc. (“IWH” or the “Company”), through its wholly owned subsidiaries; Institute for Wealth Advisors, Inc. (“IWA”), Institute for Wealth Consultants, Inc. (“IWC”) and Institute for Wealth Management, LLC (“IWM”) provides investment advisory, portfolio management, and financial planning through a network of registered investment advisors (“IARS”) to individual and institutional clients. During March 2017, the Company created an additional subsidiary known as Institute for Wealth Consultants, Inc., a Delaware corporation (“IWC”), which provides IAR support services, fee-based financial planning and access to life insurance and annuity products at ILA. IWM, IWA and IWC are registered with the SEC as a Registered Investment Adviser (“RIA”). The Company’s other subsidiary; Institute for Wealth Partners, Inc. (“IWP”) provides various advisor services, along with its affiliate, Institute for Life and Annuity, Inc. (“ILA”) to support IARs for life insurance and annuity sales. The Company acquired by merger the Institute for Wealth Management Holding, Inc. (“IWMH”), the holding company of IWM, on September 12, 2016. The financial statements for IWH include the fourth quarter 2016 financial results of IWM. The majority of revenue is derived from a full range of services related to investment management and investment advisory services from retail, 401(k), sub advisory fees and life insurance and annuity sales. The Company was incorporated in Delaware on September 3, 2008 and operations are based primarily in Dallas, Texas. Its wealth management division operates primarily in Denver, Colorado. The Company’s fiscal year ends on December 31.
Principles of Consolidation
The accompanying consolidated financial statements present the consolidated financial position, results of operations and cash flows of the Company and its subsidiaries. Significant intercompany balances and transactions have been eliminated.
Use of Estimates
The accompanying consolidated financial statements have been prepared in accordance with accounting principles generally accepted in the United States of America that require management to make estimates and assumptions that affect the reported amounts of assets and liabilities, the disclosure of contingent assets and liabilities, the reported amount of revenues and expenses during the reporting period, as well as the accompanying notes. These estimates are based on information available to the Company. Actual results could differ from these estimates.
Basis of Accounting
The consolidated financial statements of the Company are prepared on the accrual basis of accounting. The accompanying consolidated financial statements include the accounts of the Company and its wholly owned subsidiaries. All material intercompany accounts and transactions have been eliminated in consolidation.
Cash and Cash Equivalents
Cash and cash equivalents consist primarily of cash in the bank and cash investments which have an initial maturity of three months or less. Cash equivalents are valued at cost, which approximates market.
103
Table of Contents
NOTE 1. SUMMARY OF ACCOUNTING POLICIES (CONTINUED)
Accounts Receivable
Receivables recorded in the financial statements represent valid claims against debtors for services rendered or other charges arising on or before the balance sheet date. Management makes estimates of the collectability of accounts receivable. Specifically, Management analyzes accounts receivable and historical bad debts, customer credit-worthiness, current economic trends, and changes in customer payment terms and collections trends when evaluating the adequacy of the allowance for doubtful accounts. Any change in the assumptions used in analyzing a specific accounts receivable may result in additional allowances for doubtful accounts being recognized in the periods in which the change occurs. Historically, losses from uncollectible accounts have not been significant, and management has determined that no allowance is necessary as of September 30, 2017 and 2016.
Property, Equipment and Software
Property and equipment are recorded at cost. Depreciation is computed using the straight-line method over the life of the contract or estimated useful lives ranging from three to seven years. Costs incurred for upgrades and enhancements, which will not result in additional functionality, are expensed as incurred.
Goodwill and Purchase Price Allocation
The mergers and acquisitions (“M&A”) by the Company are accounted for using the purchase method of accounting. For this purpose, identifiable assets acquired and liabilities and contingent liabilities assumed through business combinations are measured at their fair value at the acquisition date. The cost of an acquisition is measured as the Company’s best estimate of fair value at the date of purchase in exchange for the consideration or, assets given, liabilities assumed and any equity or debt instruments issued by the Company in exchange for title or control, plus any costs directly attributable to the acquisition.
The excess of the cost of acquisition over the Company’s estimate of fair value of the acquired assets and liabilities is recorded as goodwill.
The Company tests goodwill semi-annually for impairment. The assessment as to whether long-lived assets are impaired is highly subjective. The calculations involve management’s best estimate of the holding period, investment returns and attrition rates. Many factors may influence management’s estimate of impairment. These conditions may change in a relatively short period of time. No impairment was recognized for the period ended December 31, 2016.
Income and Other Taxes
The determination of the Company’s provision for income taxes requires significant judgment, the use of estimates, and the interpretation and application of complex tax laws. Significant judgment is required in assessing the timing and amounts of deductible and taxable items.
The Company files an income tax return for Institute for Wealth Holdings, Inc. and subsidiaries as a single consolidated tax return.
Deferred income taxes are determined based on the difference between financial statement and tax basis of assets and liabilities using enacted tax rates in effect for the years in which such differences are expected to reverse. The temporary differences in these financial statements relate primarily to a net operating loss (“NOL”) carry-forward, deferred compensation and notes payable. Management routinely evaluates all deferred tax accounts to determine the likelihood of their realization. See Note 6 for discussion of income taxes.
104
Table of Contents
NOTE 1. SUMMARY OF ACCOUNTING POLICIES (CONTINUED)
Interest and penalties on income tax related items are included within the income tax provision and are accrued through Income Tax expense. Interest and penalties on any other tax expense are recorded in other operating expenses.
In the normal course of business, the Company and its subsidiaries consolidated tax return may be subject to an Internal Revenue Service (“IRS”) audit. As of the date of this report, management has not been notified that it is subject to an IRS audit and further, the Company is not aware of any proposed adjustments by the IRS that may directly impact the Company. The federal income tax returns of the Company for 2015, 2014 and 2013 are subject to examination by IRS, generally for three years after they are filed.
Revenue Recognition
Investment management and investment advisory fee revenues are computed under individual agreements between IWM, IWA and various clients for which these subsidiary RIAs act as an advisor or subadvisor. These fees are generally based on the market value of the assets under management (“AUM”). Advisory fees are recognized as revenue as services are performed.
The Company, through its RIAs and investment advisory representatives (“IARs”) provide various investment advisory and sub-advisory services for clients. These fees are generally based on the current market value of the assets under management. Sub-advisory fees are recognized as revenue during the period such services are performed and are presented net of expense reimbursements, customer refunds and shareholder servicing fees.
Fair Values of Financial Instruments
FASB ASC 825-10-50 requires the Company to disclose estimated fair values for its financial instruments. Management has estimated the fair values of cash and cash equivalents, receivables, prepaid expenses, accounts payable and accrued expenses to be approximately their respective carrying values reported on these statements because of their short maturities.
Concentration Risk
The Company provides, through IWM and IWA, investment advisory and related services to IARs, customers and clients in approximately twenty states. The Company believes that it does not have individually or significantly large client accounts or revenue concentrations that, in the event of the loss of such client account(s), would materially or adversely impact the Company.
NOTE 2. DEFERRED COMPENSATION
The Company has entered into agreements with its two executive officers to defer annual compensation. With the merger, IWH assumed $837,445 of Deferred Compensation (See Note 3). Deferred compensation balances as of September 30, 2017 and 2016 are $942,943 and $100,000 respectively.
NOTE 3. GOODWILL
The Company acquired Institute for Wealth Management Holdings, Inc. (“IWMH”), the holding company of IWM, on September 12, 2016. The strategy behind the merger of IWM into IWH was to operate a dual investment advisory and investment management platform for the IARs and clients through these RIA subsidiaries, which provide investment management and advisory services to clients by enrolling, supporting and supervising qualified registered investment advisors (“IARs”).
105
Table of Contents
NOTE 3. GOODWILL (CONTINUED)
The total purchase price of this transaction was $4,551,924, which consisted of $2,177,371 of the Company’s shares and $2,374,553 of assumed IWM debt.
The Company acquired 100% of IWM through a merger transaction with the exchange of the Company’s shares for the outstanding shares of IWMH. The IWH shares issued to IWMH shareholders were as follows:
| IWH Shares Issued/Exchanged to IWHM Shareholders |
||||
| Common Stock |
353,069 | |||
| Preferred Stock Series C |
1,904,404 | |||
|
|
|
|||
| Total IWH Shares Issued/Exchanged to IWMH Shareholders |
2,257,473 | |||
| IWMH Shares Outstanding Pre-Merger |
||||
| Common Stock |
220,489 | |||
| Preferred Shares Series A |
1,189,286 | |||
|
|
|
|||
| Total IWMH Shares Outstanding Pre-Merger |
1,409,775 | |||
Upon the merger and acquisition of IWMH and IWM, the Company allocated the purchase price to acquired tangible assets, consisting of current assets, prepaid assets, equipment and technology, deferred assets and intangible assets.
| Assets Acquired |
||||
| Cash |
$ | 187,665 | ||
| Accounts Receivable |
15,908 | |||
| Prepaid Expenses |
9,668 | |||
| Furniture, Equipment and Software |
8,946 | |||
| Deferred Assets and Other Intangibles |
1,252,278 | |||
| Goodwill |
3,077,459 | |||
|
|
|
|||
| Total Asset Acquired |
$ | 4,551,924 | ||
|
|
|
|||
| Payables, Accrued Expenses and Debt Assumed |
||||
| Accounts Payable and Accrued Expenses |
$ | 137,033 | ||
| Long Term Debt |
2,237,520 | |||
|
|
|
|||
| Total Payables, Accrued Expenses and Debt Assumed |
$ | 2,374,553 | ||
|
|
|
|||
| Value of IWH Shares Issued/Exchanged |
||||
| Common Stock Issued/Exchanged |
$ | 340,543 | ||
| Preferred Stock Series C Issued/Exchanged |
1,836,828 | |||
|
|
|
|||
| Total Value of IWH Shares Issued/Exchanged |
$ | 2,177,371 | ||
|
|
|
In connection with the acquisition of IWM, the Company incurred transaction costs of $711,893 and other expenses and transaction costs, which are listed in the accompanying statement of operations.
NOTE 4. NOTES PAYABLE
Notes Payable
The Company has various notes payable to individuals with interest rates ranging from 7.5% - 12% per year and a default rate of interest of 9% - 12% per year. These notes mature at dates ranging from June 15, 2012 to March 1, 2017, which have been extended and/or waived by agreement with the parties. IWH assumed $539,395 of Notes Payable in connection with the merger (See Note 3). The notes payable balances as of September 30, 2017 and 2016 were $730,374 and $284,243 respectively.
106
Table of Contents
NOTE 4. NOTES PAYABLE (CONTINUED)
Debenture Notes
The Company has various convertible debentures owed to individuals with interest rates ranging from 8% - 12% per year and a default rate of interest of 18% per year. These debenture notes call for principal and interest payments to mature December 31, 2009, and were extended annually by agreement with the parties. The debenture notes may be converted to common stock at $2.50 per share. As of September 30, 2017 and 2016, these notes include accrued interest of $170,463 and $150,463, respectively. The convertible debentures balances as of September 30, 2017 and 2016 were $215,000, respectively.
Senior Secured Notes
The Company issued $2,000,000 of 8% Senior Secured Notes to several individual investors in connection with the IWM merger in September 2016 which matures September 30, 2021. The senior notes are collateralized with corporate stock and membership interests of IWA and IWM subsidiaries. The senior notes call for quarterly interest-only payments with the principal due in full on September 30, 2021. The senior notes payable as of September 30, 2017 and 2016 were $2,000,000 and $1,650,000, respectively.
Line of Credit
IWM has a $100,000 working capital line of credit with a financial institution with no stated maturity date. The IWM line of credit was inherited with the merger (See Note 3). Interest is payable monthly at prime plus 1% (5.25%) at September 30, 2017). The line is collateralized by all of the equipment and assets of IWM and guaranteed by IWM’s manager. Outstanding borrowings under the agreement at September 30, 2017 amounted to $87,079.
NOTE 5. COMMITMENTS AND CONTIGENCIES
Operating Leases
The Company leases facilities in both Dallas and Denver under non-cancelable operating leases. Rent expense for Months ended September 30, 2017 were $59,112 and $62,127, respectively.
Minimum future rental commitments under these lease agreements as of September 30, 2017 are as follows:
| Year |
Dallas, TX Office Space |
Year |
Denver, CO Office Space |
|||||||
| 2017 4th Qtr |
$ | 14,424 | 2017 4th Qtr | $ | 20,906 | |||||
| 2018 |
59,499 | 2018 | 84,601 | |||||||
| 2019 |
61,302 | 2019 | 86,273 | |||||||
| Thereafter |
— | Thereafter | 36,238 | |||||||
|
|
|
|
|
|||||||
| Total |
$ | 135,225 | Total | $ | 228,018 | |||||
|
|
|
|
|
|||||||
Litigation
In the normal course of business, the Company may be subject to various legal proceedings and claims. The Company’s management is not aware of any threatened claim or potential liability that could materially affect its financial condition.
107
Table of Contents
NOTE 6. INCOME TAX PROVISION
Income tax expense (benefit) consists of the following:
| September 30, 2017 | 2016 Year Ended | |||||||
| Deferred Income Tax Provision (Benefit) |
— | (3,804 | ) | |||||
|
|
|
|
|
|||||
| Total Net Provision from Income Taxes |
$ | — | $ | (3,804 | ) | |||
|
|
|
|
|
|||||
The net deferred tax assets (liabilities) are reported on the accompanying balance sheet as of September 30, 2017 and 2016:
| September 30, 2017 | September 30, 2016 | |||||||
| Net Deferred Tax Assets (Liabilities) - Non-current: |
||||||||
| Net Operating Losses |
$ | 1,414,917 | $ | 619,722 | ||||
| Deferred Compensation |
373,597 | — | ||||||
| Depreciation on property and equipment |
(1,678 | ) | — | |||||
| Amortization on intangible assets and software |
3,329 | — | ||||||
| Prepaids & receivables |
(9,266 | ) | — | |||||
| Accrued Expenses & Other Accured Liabilities |
92,219 | — | ||||||
| Other Deferred Tax Assets |
2,400 | — | ||||||
|
|
|
|
|
|||||
| Net Deferred Tax Assets (Liabilities) - Non-current |
$ | 1,875,518 | $ | 619,722 | ||||
|
|
|
|
|
|||||
The provision for income taxes shown on the Statements of Operations differ from the amount that would result from applying statutory tax rates to income before income taxes primarily because of the blended marginal tax rate (estimated at approximately 31% at December 31, 2016) used to compute deferred taxes, and permanent differences between determining income for financial statement purposes and computing taxable income. Permanent differences are primarily from nondeductible meals and entertainment expenses and other tax return adjustments. IWH assumed $1,195,487 of Deferred Tax Asset – non-current in connection with the merger (See Note 3).
NOTE 7. RELATED PARTY TRANSACTIONS
The Company has several Senior Secured notes payable to officers, directors and shareholders. As of September 30, 2017, the outstanding balances due to related parties as holders of the senior notes were $875,000, described in Note 4.
NOTE 8. CAPITAL STRUCTURE
Preferred Stock
Current Preferred Stock outstanding includes the Company’s designated Series B and C Convertible Preferred Stock (the “Preferred Stock”). As of September 30, 2017, the Company had the following shares outstanding:
| Preferred Stock |
Authorized Shares | Outstanding Shares | ||||||
| Series A Convertible Preferred Stock |
5,000 | — | ||||||
| Series B Convertible Preferred Stock |
70,000 | 59,180 | ||||||
| Series C Convertible Preferred Stock |
1,925,000 | 1,904,404 | ||||||
|
|
|
|
|
|||||
| Total Preferred Stock |
2,000,000 | 1,963,584 | ||||||
108
Table of Contents
NOTE 8. CAPITAL STRUCTURE (CONTINUED)
Series B Convertible Preferred Stock
Series B Convertible Preferred Stock ranks on par with Series C Convertible Preferred Stock with respect to dividends, redemption, liquidation, dissolution and winding up. Series B Convertible Preferred Stock has a cumulative dividend rate of 7% per annum, accruing quarterly, payable as declared by the Company’s Board of Directors. The dividend rate payable on the Series B Convertible Preferred Stock is indexed to the Consumer Price Index if such index is 7% or greater. The Series B Convertible Preferred Stock does not have the right to vote, except for (i) an amendment to any right applicable to Series B Convertible Preferred Stock or provisions to the Certificate of Incorporation that adversely affects Series B Convertible Preferred Stock, (ii) the creation of a class of stock, unless such stock ranks junior to Series B Convertible Preferred Stock with respect to dividends and liquidation preference, or (iii) the issuance or obligation to issue additional Series B Convertible Preferred Stock or Series C Convertible Preferred Stock. In the event of a liquidation, holders of Series B Convertible Preferred Stock are entitled to the greater of $10 per share plus any accumulated but unpaid dividends or the amount such share would have been entitled to had it been converted into common stock. Each share of Series B Convertible Preferred Stock is convertible into four shares of common stock at a conversion price of $2.50 per share at the election of the holder. As of September 30, 2017 and 2016, there were un-declared dividends in the amount of $314,488 and $273,033 respectively.
Series C Convertible Preferred Stock
Holders of Series C Convertible Preferred Stock vote as a class with the common stock on an as converted basis. An affirmative vote of the majority of the Series C Convertible Preferred Stock is needed to (i) amend any right applicable to Series C Convertible Preferred Stock or any provision of the Certificate of Incorporation that adversely affects Series C Convertible Preferred Stock, (ii) create a class of stock, unless such stock ranks junior to Series C Convertible Preferred Stock with respect to dividends and liquidation, or (iii) issue or obligate the Company to issue any additional shares of Series B Convertible Preferred Stock or Series C Convertible Preferred Stock. In the event of a liquidation, holders of Series C Convertible Preferred Stock are entitled to the greater of $1.2489 per share plus any accumulated but unpaid dividends or the amount such share would have been entitled to had it been converted into common stock. Holders of Series C Convertible Preferred Stock may elect to convert their shares into shares of common stock.
After the payment of the full liquidation preference of Preferred Stock, the remaining assets of the Company legally available for distribution are to be distributed ratably to the holders of common stock. However, a Preferred Stockholder is entitled to receive, on a pro rata basis, the greater of the amount of cash, securities, or other property the Preferred Stockholder would be entitled to receive in a liquidation event if the Preferred Stock had been converted to common stock immediately prior to the acquisition or asset transfer. The Series C Convertible Preferred Stock currently pays no dividend.
109
Table of Contents
NOTE 8. CAPITAL STRUCTURE (CONTINUED)
Warrants
In connection with the 2009-2010 Series B Preferred Stock Offering, the Series B Preferred shares sold in the offering included detachable warrants which granted the investors the right to purchase common stock at $2.50 per share in an amount equal to the number of preferred shares purchased. These warrants expire on December 31, 2019. As of September 30, 2017 and 2016, the number of warrants issued and outstanding were for 70,430 common shares.
In connection with the 8% Senior Secured Notes Offering in 2016, each investor was given a detachable warrant to purchase shares of common stock. For every $100,000 of Senior Notes purchased, the investor was granted a warrant to purchase 10,000 shares of common stock at $0.01 per share. As of September 30, 2017, a total of 207,500 warrants were issued in connection with the Senior Notes offering. As of September 30, 2017, a total of 145,000 warrants were exercised and 62,500 warrants remain outstanding.
Common Stock
The Company also has authorized a class of common stock, par value $0.001. As of September 3, the authorized common stock was 10,000,000 shares. Total shares issued and outstanding as of September 30 2017 and September 2016, were 2,700,710 and 2,202,640, respectively.
NOTE 9. SUBSEQUENT EVENTS
The Company has evaluated subsequent events through January 19, 2018, the date which the financial statements were available to be issued.
On October 1, 2017, the Company began offering up to a maximum of 2,500,000 shares of Series D Convertible Preferred Stock, par value $0.001, in a private offering. The offering period was from October 1, 2017 through December 20, 2017. IWH had the following Preferred Stock Series D transactions:
Sale of 76,637 shares of Series D Convertible Preferred Stock for a sum of $611,000.
Exchange of 16,430 shares of Series B Convertible Preferred Stock, including dividends, for 25,403 shares ($254,030) of Series D Convertible Preferred Stock.
Exchange of outstanding Senior 8% notes, plus accrued interest, in the amount of $1,375,000 for 140,260 shares ($1,402,600) of Series D Convertible Preferred Stock.
Exchange of $150,000 Note Payable for 25,000 shares ($250,000) of Series D Convertible Preferred Stock.
In December 2017, a shareholder of Series C Convertible Preferred Stock exercised its Put-Call agreement. The agreement calls for IWH to purchase all shares of Series C Convertible Preferred Stock held by such shareholder for $350,000. The transaction has a completion deadline of January 18, 2018. The Company anticipates negotiating a settlement with this shareholder.
In December 2017, the Company dissolved IWMH, the holding company for IWM acquired in September 2016, as IWMH no longer served any useful purpose.
In December 2017, the Tax Cuts and Jobs Act was passed by Congress. This legislation consists of a corporate tax rate reduction from 35% to 21%. This Act limits the NOL reduction in a carryback year or carryforward year to 80% of the taxable income that year determined without regard to the NOL reduction. NOLs may be carried forward indefinitely.
110
Table of Contents
INDEX
[EXHIBIT INDEX]
Table of Contents
[EXHIBIT INDEX]
Table of Contents
SIGNATURES
Pursuant to the requirements of Regulation A, the issuer certifies that it has reasonable grounds to believe that it meets all of the requirements for filing on Form 1-A and has duly caused this offering statement to be signed on its behalf by the undersigned, thereunto duly authorized, in the city of Dallas, in the State of Texas, on March 13, 2018.
| INSTITUTE FOR WEALTH HOLDINGS, INC. | ||
| By: | /s/ Dewey M. Moore, Jr. | |
| Dewey M. Moore, Jr., Chief Executive Officer | ||
This offering statement has been signed by the following persons in the capacities and on the dates indicated.
| Signature |
Title |
Date | ||
| /s/ Dewey M. Moore, Jr. |
Chief Executive Officer/Director | 03/13/2018 | ||
| Dewey M. Moore, Jr. | ||||
| /s/ Matthew Medeiros |
Executive Vice President/Director | 03/13/2018 | ||
| Matthew Medeiros | ||||
| /s/ Don Schulz |
Chief Financial Officer | 03/13/2018 | ||
| Don Schulz | ||||
| /s/ Lloyd E. Allen, Jr. |
Director | 03/13/2018 | ||
| Lloyd E. Allen, Jr. | ||||
| /s/ J. Timothy Brittan |
Director | 03/13/2018 | ||
| J. Timothy Brittan | ||||
[SIGNATURE PAGE]