POST-QUALIFICATION AMENDMENT TO OFFERING
STATEMENT QUALIFIED EFFECTIVE SEPTEMBER 15, 2017
FILED PURSUANT TO RULE 253(g)(2)
FILE NO.: 024-10649
Regulation A Offering Statement
Part II – Offering Circular
June 7, 2018
AN OFFERING STATEMENT PURSUANT TO REGULATION A RELATING TO THESE SECURITIES HAS BEEN FILED WITH THE SECURITIES AND EXCHANGE COMMISSION. INFORMATION CONTAINED IN THIS PRELIMINARY OFFERING CIRCULAR IS SUBJECT TO COMPLETION OR AMENDMENT. THESE SECURITIES MAY NOT BE SOLD NOR MAY OFFERS TO BUY BE ACCEPTED BEFORE THE OFFERING STATEMENT FILED WITH THE COMMISSION IS QUALIFIED. THIS PRELIMINARY OFFERING CIRCULAR SHALL NOT CONSTITUTE AN OFFER TO SELL OR THE SOLICITATION OF AN OFFER TO BUY NOR MAY THERE BE ANY SALES OF THESE SECURITIES IN ANY STATE IN WHICH SUCH OFFER, SOLICITATION OR SALE WOULD BE UNLAWFUL BEFORE REGISTRATION OR QUALIFICATION UNDER THE LAWS OF ANY SUCH STATE. WE MAY ELECT TO SATISFY OUR OBLIGATION TO DELIVER A FINAL OFFERING CIRCULAR BY SENDING YOU A NOTICE WITHIN TWO BUSINESS DAYS AFTER THE COMPLETION OF OUR SALE TO YOU THAT CONTAINS THE URL WHERE THE FINAL OFFERING CIRCULAR OR THE OFFERING STATEMENT IN WHICH SUCH FINAL OFFERING CIRCULAR WAS FILED MAY BE OBTAINED.

Impact Housing REIT, LLC
23901 Calabasas Road Suite 2010
Calabasas, CA 93102
(818) 737-8000
www.ImpactHousing.com
This Offering Circular follows the Form S-11 disclosure format.
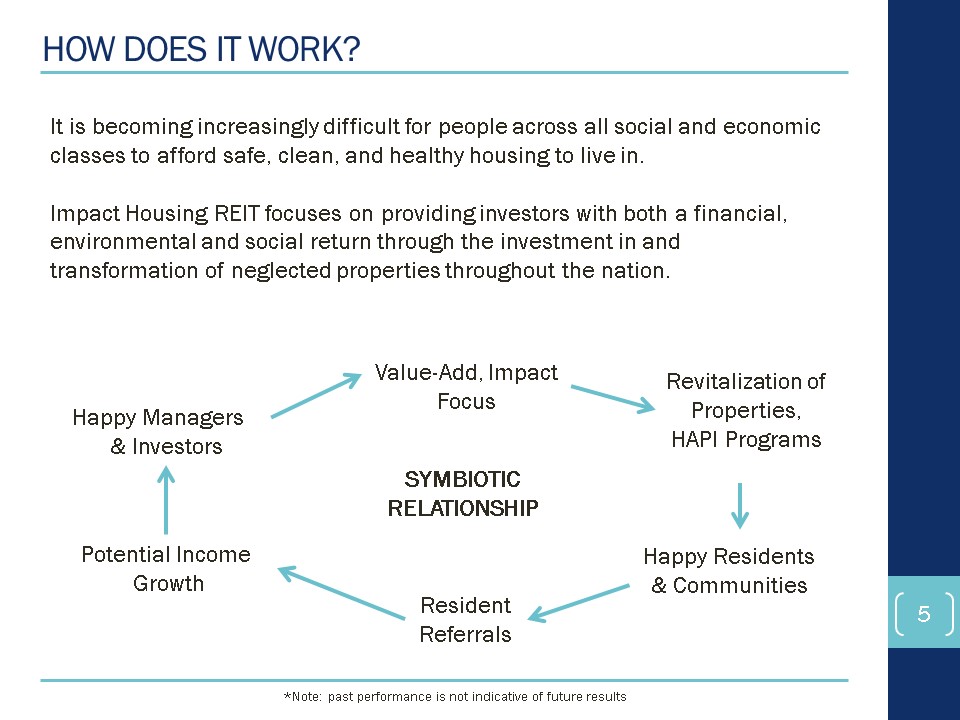
Impact Housing REIT, LLC, a newly organized Delaware limited liability company (which we refer to as the “Fund,” “we,” “us” or “our”), was formed to acquire, redevelop, and manage residential real estate assets in the United States, with a focus on acquiring and improving undervalued multifamily residential properties that provide affordable value to residents. The Fund is managed by affiliates of Strategic Realty Holdings, LLC, an experienced real estate investment firm, which we refer to as our “Sponsor.” We intend to qualify as a real estate investment trust, “REIT,” for federal income tax purposes.
The Fund is seeking to raise capital by offering to the public limited liability company interests designated as “Series A Investor Shares,” in what we refer to as the “Offering.” You can read a complete description of these securities in the “Securities Being Offered” section starting on page 45. We refer to individuals and entities that purchase Series A Investor Shares as “Investors.”
The minimum we are seeking to raise in this Offering is $3,000,000, and the maximum is $35,000,000. The Sponsor and/or its affiliates might purchase Series A Investor Shares and if they do their purchases will count toward the $3,000,000 minimum. We will begin selling Series A Investor Shares when the Offering has been “qualified” by the Securities and Exchange Commission.
The Offering will begin as soon as our offering statement is “qualified” by the SEC. The Offering will end upon the earlier of (1) the date we have sold $35,000,000 of Series A Investor Shares (i.e., all the securities we are offering), (2) the date two years after it begins, or (3) the date we decide to end it. If we do not raise at least $3,000,000 on or before December 31, 2018, we will terminate the Offering and return any money we’ve raised to that point, without any deductions.
Initially, the Series A Investor Shares will be sold for $10.00 per Series A Investor Share, with a minimum initial investment of 100 Series A Investor Shares (i.e., $1,000). We may periodically raise or lower the price of the Series A Investor Shares during this offering to reflect the value of the Fund’s assets by filing a supplement or an amendment to this Offering Circular. For more information, see the “Securities Being Offering – Price of Series A Investor Shares” section starting on page 45.
We are selling these securities directly to the public through www.ImpactHousing.com and www.ImpactHousingIRA.com, which we refer to collectively as the “Site.” We have also engaged Folio Investments, Inc. (“Folio”), a registered broker-dealer and member FINRA/SIPC, to market and sell our Series A Investor Shares on a non-exclusive, best efforts basis. Folio is not purchasing the Series A Investor Shares and is not required to sell any specific number or dollar amount of Series A Investor Shares. Folio is entitled to receive a sales commission equal to 2.5% of the gross proceeds from the Series A Investor Shares that it sells, a processing fee equal to 0.7% of the gross proceeds from the Series A Investor Shares that it sells, and a platform fee equal to 0.3% of the gross proceeds from the Series A Investor Shares that it sells. Folio may also be entitled to certain additional compensation from the Fund for providing related certain technology and closing services. See “Plan of Distribution” beginning on page 51 for more information regarding the fees payable to Folio.
|
Price to Public
|
Sales Commissions
& Fees*
|
Proceeds to Issuer
|
Proceeds to Other
Persons
|
|
|
Per Share
|
$10.00
|
$0.35*
|
$9.65*
|
n/a
|
|
Total (Minimum
Offering Amount)
|
$3,000,000.00
|
$105,000.00*
|
$2,895,000.00*
|
n/a
|
|
Total (Maximum
Offering Amount)
|
$35,000,000.00
|
$1,225,000.00*
|
$33,775,000.00*
|
n/a
|
*For illustrative purposes we have assumed in this table that all sales will be made through Folio. As noted above, the Fund has retained Folio on a non-exclusive basis and the Fund intends to simultaneously sell the Series A Investor Shares through the Fund’s Site, which sales will not be subject to Folio’s commissions.
When you invest in the Fund through the Site, your money will be held in an escrow account with First Green Bank, a third-party financial institution, until:
| · |
We review your subscription and decide whether to accept it; and
|
| · |
We have raised at least $3,000,000.
|
When and if those two conditions are satisfied, we will release your money from the escrow account to the Fund at a time we select.
When you invest in the Fund through the Folio online brokerage platform, your money will be held in your Folio brokerage account until the two conditions to closing described above have been met and there is a closing.
Investing in our Series A Investor Shares is speculative and involves substantial risks. You should purchase these securities only if you can afford a complete loss of your investment. Before investing, you should carefully review the “Risks of Investing” beginning on page 2.
THE UNITED STATES SECURITIES AND EXCHANGE COMMISSION DOES NOT PASS UPON THE MERITS OF OR GIVE ITS APPROVAL TO ANY SECURITIES OFFERED OR THE TERMS OF THE OFFERING. NOR DOES IT PASS UPON THE ACCURACY OR COMPLETENESS OF ANY OFFERING CIRCULAR OR OTHER SOLICITATION MATERIALS. THESE SECURITIES ARE OFFERED PURSUANT TO AN EXEMPTION FROM REGISTRATION WITH THE COMMISSION; HOWEVER, THE COMMISSION HAS NOT MADE AN INDEPENDENT DETERMINATION THAT THE SECURITIES OFFERED HEREUNDER ARE EXEMPT FROM REGISTRATION.
GENERALLY, NO SALE MAY BE MADE TO YOU IN THIS OFFERING IF THE AGGREGATE PURCHASE PRICE YOU PAY IS MORE THAN 10% OF THE GREATER OF YOUR ANNUAL INCOME OR NET WORTH. DIFFERENT RULES APPLY TO ACCREDITED INVESTORS AND NON-NATURAL PERSONS. BEFORE MAKING ANY REPRESENTATION THAT YOUR INVESTMENT DOES NOT EXCEED APPLICABLE THRESHOLDS, WE ENCOURAGE YOU TO REVIEW RULE 251(d)(2)(i)(C) OF REGULATION A. FOR GENERAL INFORMATION ON INVESTING, WE ENCOURAGE YOU TO REFER TO WWW.INVESTOR.GOV. FOR MORE INFORMATION, SEE THE “Limit on How Much Non-Accredited Investors Can Invest” SECTION STARTING ON PAGE 50.
NORTH AMERICAN SECURITIES ADMINISTRATORS ASSOCIATION UNIFORM LEGEND:
YOU SHOULD MAKE YOUR OWN DECISION WHETHER THIS OFFERING MEETS YOUR INVESTMENT OBJECTIVES AND RISK TOLERANCE LEVEL. NO FEDERAL OR STATE SECURITIES COMMISSION HAS APPROVED, DISAPPROVED, ENDORSED, OR RECOMMENDED THIS OFFERING. NO INDEPENDENT PERSON HAS CONFIRMED THE ACCURACY OR TRUTHFULNESS OF THIS DISCLOSURE, NOR WHETHER IT IS COMPLETE. ANY REPRESENTATION TO THE CONTRARY IS ILLEGAL.
THESE SECURITIES ARE SUBJECT TO RESTRICTIONS ON TRANSFERABILITY AND RESALE AND MAY NOT BE TRANSFERRED OR RESOLD EXCEPT AS PERMITTED UNDER THE ACT AND APPLICABLE STATE SECURITIES LAWS, PURSUANT TO REGISTRATION OR EXEMPTION THEREFROM. YOU SHOULD BE AWARE THAT YOU WILL BE REQUIRED TO BEAR THE FINANCIAL RISKS OF THIS INVESTMENT FOR AN INDEFINITE PERIOD OF TIME.
Table of Contents
|
A WARNING ABOUT FORWARD-LOOKING STATEMENTS
|
1
|
|
RISKS OF INVESTING
|
2
|
|
This is a “Blind Pool” Offering
|
2 |
|
We Are a Newly Formed Business With a Limited Operating History
|
2
|
|
Our Auditor Has Raised Questions About our Ability To Survive as a Going Concern
|
2 |
|
No Guaranty of Distributions
|
3
|
|
Arbitrary Pricing
|
3
|
|
Speculative Nature of Real Estate Investing
|
3
|
|
Property Values Could Decrease
|
3
|
|
Illiquidity of Real Estate:
|
4
|
|
Investors Will Have No Right to Participate in the Management of the Fund:
|
4
|
|
We Rely on Our Sponsor and Its Affiliates
|
4
|
|
Selection of Properties
|
4
|
|
Incomplete Due Diligence:
|
4
|
|
Pricing of Assets
|
5
|
|
Competition for Properties
|
5
|
|
Inability to Attract and/or Retain Tenants
|
5
|
|
Operating Expenses
|
5
|
|
Unit Rehabilitation and Capital Improvements
|
6
|
|
Risks Associated with Development and Construction
|
6
|
|
Risks Associated with Relying on Third Parties:
|
6
|
|
Unreliable Financial Projections
|
6
|
|
Lack of Diversification
|
6
|
|
Our Ability To Implement Our Investment Strategy Will Depend On the Success of this Offering
|
6
|
|
Changes To Our Investment Strategy:
|
6
|
|
Inability to Implement Liquidity Transactions:
|
7
|
|
Need for Additional Capital
|
7
|
|
Risk of Dilution
|
7
|
|
Future Securities Could Have Superior Rights
|
7 |
i
|
Risks Associated with Leverage
|
7 |
|
Risks of Seller Financing
|
8
|
|
The Fund Does Not Have A Credit Rating from Moody’s or Standard & Poor’s
|
8
|
|
Limited Warranties from Sellers
|
8
|
|
Liability for Personal Injury
|
8
|
|
Environmental Risks:
|
8
|
|
ADA Compliance
|
8
|
|
Regulation and Zoning
|
8
|
|
Casualty Losses
|
9
|
|
Changes in Laws
|
9
|
|
Limitation on Rights in LLC Agreement
|
9
|
|
Limitation on Rights in Investment Agreement
|
9 |
|
Waiver of Jury Trials
|
10 |
|
Forum Selection Provision
|
10 |
|
Conflicts of Interests
|
10
|
|
No Market for the Series A Investor Shares; Limits on Transferability
|
11
|
|
Our Sponsor’s Track Record Does Not Guaranty Future Performance
|
12
|
|
Investors Can’t See Our Actual Investments Before Investing:
|
12
|
|
The Fund Stands On Its Own
|
12
|
|
Uninsured Losses
|
12
|
|
Regulation as an Investment Company
|
12
|
|
Reduced Disclosure Requirements Under the JOBS Act:
|
12
|
|
We Are an “Emerging Growth Company” Under the JOBS Act
|
13
|
|
We Are Not Subject to the Corporate Governance Requirements that Apply to Companies
Listed on a National Exchange |
13
|
|
Failure to Satisfy Conditions of REIT; Taxes on REITs
|
13
|
|
We Have Limited Experience Operating a REIT
|
13
|
|
REIT Requirements Could Restrict Actions
|
14
|
|
Required Distributions
|
14
|
|
Federal and State Income Taxes as a REIT
|
14
|
|
Risk Related to Joint Ventures:
|
14
|
|
Breaches of Security
|
15
|
ii
|
FIRPTA Tax on Non-U.S. Sellers:
|
15
|
|
Political Uncertainty
|
15
|
|
THE FUND
|
16 |
|
Investment Strategy
|
16 |
|
Summary of Investment Strategy
|
16 |
|
Focus on Underperforming Communities
|
16
|
|
Geographic Focus
|
17
|
|
Demographic Focus
|
17
|
|
Innovative Underwriting Process and Strategic Planning
|
18
|
|
Impact Investing
|
18 |
|
Management of Business and Investments
|
19
|
|
Management of Properties
|
19
|
|
Leverage
|
20
|
|
Joint Ventures
|
20
|
|
Competition
|
20
|
|
The Competitive Landscape
|
20
|
|
Our Competitive Advantages
|
21
|
|
Our Operating Strategies
|
22
|
|
Reposition Tenant Base
|
22
|
|
Outsource Property Management
|
22
|
|
Actively Manage Our Communities
|
22
|
|
Control Operating Expenses
|
23
|
|
Use Technology
|
23
|
|
Possible Commercial Component
|
24
|
|
Disposition of Properties
|
24
|
|
Term of the Fund
|
24
|
|
SUMMARY OF INVESTMENT OPPORTUNITY UNDER REVIEW
|
25
|
|
WHAT IS A REIT, ANYWAY?
|
30
|
|
OUR ORGANIZATIONAL STRUCTURE
|
31
|
|
OUR MANAGEMENT TEAM
|
32
|
|
Edward P. Lorin
|
32
|
|
Myron Chang
|
33
|
iii
| Andy Park | 33 |
|
COMPENSATION OF MANAGEMENT
|
34
|
|
Overview
|
34
|
| Fees | 34 |
|
Co-Investment
|
36 |
|
Promoted Interest
|
37
|
|
Report to Investors
|
37
|
|
Clawback
|
37
|
|
Method of Accounting
|
37
|
|
Stages of Development
|
38
|
|
SECURITY OWNERSHIP OF MANAGEMENT
|
39 |
|
MANAGEMENT’S DISCUSSION AND ANALYSIS OF FINANCIAL CONDITION
AND RESULTS OF OPERATIONS |
40
|
|
Liquidity
|
40
|
|
Capital Resources
|
40
|
|
Results of Operations
|
40
|
|
Off Balance Sheet Arrangements
|
40
|
|
PAST PERFORMANCE: OUR TRACK RECORD SO FAR
|
41
|
|
Summary and Narrative Description
|
41
|
|
Strategic Realty Holdings, LLC and Strategic Realty Capital, LLC
|
42
|
|
Strategy and Results
|
42
|
|
Acquisitions of Properties Within Last Three Years
|
44
|
|
Prior Performance Tables
|
44
|
|
SECURITIES BEING OFFERED
|
45
|
|
Description of Securities
|
45
|
|
Price of Series A Investor Shares
|
45
|
|
Voting Rights
|
45
|
|
Distributions
|
46
|
|
How We Decide How Much To Distribute
|
48
|
|
Withholding
|
48
|
|
No Guaranty
|
48
|
|
Transfers
|
48
|
iv
|
Mandatory Redemptions
|
48
|
|
Limited Right Of Redemption
|
49
|
|
LIMIT ON AMOUNT NON-ACCREDITED INVESTORS CAN INVEST
|
50
|
|
PLAN OF DISTRIBUTION
|
51 |
|
Size of Offering
|
51 |
|
Term of Offering
|
51
|
|
Minimum Initial Investment
|
51
|
|
Manner of Distribution
|
51
|
|
Sales Made Through the Fund’s Site
|
51 |
|
Sales Made Through Folio
|
51 |
|
Folio Technology & Closing Services
|
52 |
|
How To Invest
|
53 |
|
To Invest Through the Fund’s Site
|
53 |
|
To Invest Through Folio
|
53 |
|
Escrow
|
54 |
|
Advertising the Offering
|
55
|
|
Supplements and Amendments to Offering Circular
|
55
|
|
ESTIMATED USE OF PROCEEDS
|
56
|
|
INVESTMENT COMPANY ACT LIMITATIONS
|
57
|
|
SUMMARY OF OUR LLC AGREEMENT AND AUTHORIZING RESOLUTION
|
58
|
|
Formation and Ownership
|
58
|
|
Shares and Ownership
|
58
|
|
Management
|
59
|
|
Exculpation and Indemnification of Manager
|
59
|
|
Obligation to Contribute Capital
|
60
|
|
Personal Liability
|
60
|
|
Distributions
|
60
|
|
Transfers and First Right of Refusal
|
60
|
|
Death, Disability, Etc.
|
60
|
|
Fees to Manager and Affiliates
|
61
|
|
Mandatory Redemption
|
61
|
|
“Drag-Along” Right
|
61
|
v
|
Limited Redemption Right
|
61
|
|
Electronic Delivery
|
61
|
|
Amendment
|
61
|
|
Information Rights
|
62
|
|
SUMMARY OF MANAGEMENT AGREEMENT
|
63
|
|
ALLOCATION OF EXPENSES AND INVESTMENT OPPORTUNITIES
|
65
|
|
Payment of Expenses
|
65
|
|
Allocation of Investment Opportunities
|
66
|
|
Other Funds
|
66
|
|
Allocation of Certain Low-Income Housing Opportunities
|
67 |
|
FEDERAL INCOME TAX CONSEQUENCES
|
68
|
|
Federal Income Taxation of the Fund
|
68
|
|
Requirements for Qualifying as a REIT
|
69
|
|
Organizational Requirements
|
69
|
|
Income Test Requirements
|
70
|
|
Asset Test Requirements
|
71
|
|
Annual Distribution Requirements
|
72
|
|
Taxation Of Investors
|
72
|
|
How Income is Reported To Investors
|
72
|
|
Taxation of Distributions
|
72
|
|
Taxation of Losses
|
73
|
|
Additional Medicare Tax
|
73
|
|
Tax on Sale of Series A Investor Shares
|
73
|
|
Passive Activity Losses
|
73
|
|
Withholding Taxes
|
73
|
|
LEGAL PROCEEDINGS
|
74
|
|
CERTAIN RELATIONSHIPS AND RELATED TRANSACTIONS
|
75
|
|
TESTING THE WATERS MATERIALS
|
76 |
|
FINANCIAL STATEMENTS
|
77
|
|
APPENDIX A – RESULTS OF PRIOR PROGRAMS
|
81 |
|
GLOSSARY OF DEFINED TERMS
|
140
|
vi
A WARNING ABOUT FORWARD-LOOKING STATEMENTS
The term “forward-looking statements” means any statements, including financial projections, that relate to events or conditions in the future. Often, forward-looking statements include words like “we anticipate,” “we believe,” “we expect,” “we intend,” “we plan to,” “this might,” or “we will.” The statement “We believe demographic shifts will favor apartment communities” is an example of a forward-looking statement.
Because we are talking about a new business, most of the things we say in this Offering Circular are forward-looking statements. In fact, everything we say is a forward-looking statement, other than statements of historical fact.
Forward-looking statements are, by their nature, subject to uncertainties and assumptions. The statement “We believe demographic shifts will favor apartment communities” is not like the statement “We believe the sun will rise in the East tomorrow.” It is impossible for us to know exactly what is going to happen in the future, or even to anticipate all the things that could happen. Our business could be subject to many unanticipated events, including all of the things we talk about in the “Risks of Investing” section starting on page 2.
Consequently, the actual result of investing in the Fund could (and almost certainly will) differ from those anticipated or implied in any forward-looking statement, and the differences could be both material and adverse. We do not undertake any obligation to revise, or publicly release the results of any revision to, any forward-looking statements, except as required by applicable law. GIVEN THE RISKS AND UNCERTAINTIES, PLEASE DO NOT PLACE UNDUE RELIANCE ON ANY FORWARD-LOOKING STATEMENTS.
Page | 1
RISKS OF INVESTING
BUYING SERIES A INVESTOR SHARES IS SPECULATIVE AND INVOLVES SIGNIFICANT RISK, INCLUDING THE RISK THAT YOU COULD LOSE SOME OR ALL OF YOUR MONEY. THIS SECTION DESCRIBES WHAT WE BELIEVE ARE THE MOST SIGNIFICANT RISK FACTORS AFFECTING THE FUND AND ITS INVESTORS. THE ORDER IN WHICH THESE FACTORS ARE DISCUSSED IS NOT INTENDED TO SUGGEST THAT SOME FACTORS ARE MORE IMPORTANT THAN OTHERS.
This is a “Blind Pool” Offering: As of the date of this Offering Circular, the Fund has not yet acquired any assets. Consequently, you will have to decide whether to invest based on our Sponsor’s experience, reputation, and track record, our business plan (all as described in this Offering Circular), and other factors you believe are relevant, rather than seeing and evaluating actual real estate assets. This structure is sometimes called a “blind pool offering.”
We Are a Newly Formed Business With a Limited Operating History: Although our Sponsor’s management team is composed of experienced real estate professionals, the Fund itself is a start-up business with a very limited operating history, minimal operating capital, no significant assets and no revenues. Like any start-up, the Fund will face a number of challenges, including:
| · | Developing a reputation and brand identity |
| · | Raising capital |
| · | Controlling costs |
| · | Responding effectively to the offerings of existing and future competitors |
| · | Managing growth and expansion |
| · | Implementing adequate accounting and financial systems and controls |
Our Auditor Has Raised Questions About our Ability To Survive as a Going Concern: In the audited financial statements attached to this Offering Circular, our auditor has noted the Fund has not yet commenced planned principal operations and has not generated revenues or profits since inception, and that these factors, among others, raise substantial doubt about the Fund’s ability to continue as a “going concern.” As further noted by our auditor, the Fund’s ability to continue as a going concern in the next twelve months is dependent upon its ability to obtain capital financing from investors sufficient to meet current and future obligations, and to deploy that capital effectively to produce profits. No assurance can be given that the Fund will be successful in these efforts.
Page | 2
No Guaranty of Distributions: When you buy a certificate of deposit from a bank, the Federal government (through the FDIC) guaranties you will get your money back. Buying a Series A Investor Share of the Fund is not like that at all. The ability of the Fund to make the distributions you expect, and ultimately to give you your money back, depends on a number of factors, including some beyond its control. Nobody guaranties that you will receive distributions.
Arbitrary Pricing: The initial price of our Series A Investor Shares was determined arbitrarily by the Manager, and was not determined by an independent appraisal of the Fund’s value and bears no relationship to traditional measures of value such as EBITDA (earnings before interest, taxes, depreciation, and amortization), cash flow, revenue, or book value.
Speculative Nature of Real Estate Investing: Real estate can be risky and unpredictable. For example, many experienced, informed people lost money when the real estate market declined in 2007-8. Time has shown that the real estate market goes down without warning, sometimes resulting in significant losses. Some of the risks of investing in real estate include changing laws, including environmental laws; floods, fires, and other Acts of God, some of which can be uninsurable; changes in national or local economic conditions; changes in government policies, including changes in interest rates established by the Federal Reserve; and international crises. You should invest in real estate in general, and in the Fund in particular, only if you can afford to lose your investment and are willing to live with the ups and downs of the real estate industry.
Property Values Could Decrease: The value of the property we own could decline, perhaps significantly. Factors that could cause the value of our property to decline include, but are not limited to:
| · | Changes in interest rates |
| · | Competition from existing properties and new construction |
| · | Changes in national or local economic conditions |
| · | Changes in zoning |
| · | Environmental contamination or liabilities |
| · | Changes in local market conditions |
| · | Fires, floods, and other casualties |
| · | Uninsured losses |
| · | Undisclosed defects in property |
| · | Incomplete or inaccurate due diligence |
Page | 3
Illiquidity of Real Estate: Real estate is generally illiquid, meaning that it is not typically capable of being readily sold for cash at fair market value. Thus, the Fund might not be able to sell properties as quickly or on the terms that it would like. For one thing, we cannot predict how long it will take to find a willing and able buyer. For another thing, we might be required to expend significant amounts of money to correct defects or make improvements before a property can be sold. Moreover, the overall economic conditions that might cause the Fund to want to sell properties are generally the same as those in which it would be most difficult to sell.
Investors Will Have No Right to Participate in the Management of the Fund: You will not have a right to vote or otherwise participate in managing the Fund, except on very limited matters. Instead, the Manager will make all decisions, including investment decisions. Investors will have the right to remove the Manager only in very limited circumstances.
We Rely on Our Sponsor and Its Affiliates: Neither the Fund itself nor the Manager will have any employees. Instead, we will rely on our Sponsor’s management team. Accordingly, our ability to achieve our investment objectives and to pay distributions to you will depend upon the ability of our Sponsor’s real estate professionals. If the principals of our Sponsor left or became unable to perform their job duties, we might be unable to execute on our investment strategy and the value of your investment in the Fund could suffer. Any adverse changes in our relationship with our Sponsor, or in our Sponsor’s operations or financial condition, could also adversely affect the Fund and thus the value of your investment.
Selection of Properties: To achieve satisfactory returns for our investors, the Manager must identify properties that satisfy our investment selection criteria and that can be acquired at reasonable prices. There is no guaranty that the Manager will be able to do so. Because the Fund is a newly organized entity and has not yet acquired any properties, you will not have an opportunity to evaluate the terms of any transactions or other financial data concerning our selected properties prior to investing. We cannot be sure that we will be successful in identifying and acquiring properties on financially attractive terms, or that we will achieve our investment objectives. Further, we could face delays in locating suitable investment properties. Such delays could decrease returns on your investment.
Incomplete Due Diligence: The Manager intends to perform “due diligence” on each asset we purchase, meaning that we will seek out and review information about the property, seller, market and other information the Manager deems relevant. However, due diligence is as much an art as a science. As a practical matter, it is simply impossible to review all of the information about a given piece of real estate, and there is no assurance that all of the information we will review will be accurate or complete in all respects. For example, sometimes important information is hidden or simply unavailable, or a third party might have an incentive to conceal information or provide inaccurate information, and we cannot verify all the information we receive independently. It is also possible that we will reach inaccurate conclusions about the information we review.
Page | 4
Pricing of Assets: The success of the Fund and its ability to make distributions to Investors depends on the Manager’s ability to gauge the value of real estate assets. Although the Manager and its principals are experienced real estate investors and will rely on various objective criteria to select properties for investment, ultimately the value of these assets is as much an art as a science, and there is no guaranty that the Fund and its advisors will be successful.
Competition for Properties: The U.S. commercial real estate market today is competitive, with an abundance of capital chasing a limited supply of quality properties. Our competitors may have greater financial resources than we do and a greater ability to borrow funds to acquire properties. The fierce competition for quality properties will tend to limit our choices and increase the amount we are required to pay for properties that meet our investment criteria, which in turn will tend to reduce yields.
Inability to Attract and/or Retain Tenants: Our success depends on our ability to attract and retain tenants in our properties. The risks we face include the following:
| · | Competition from other landlords could keep us from raising rents, or require us to provide financial or other inducements or concessions to attract tenants (e.g., rent concessions or costs incurred for tenant improvements). |
| · | Changes in economic conditions generally could reduce demand for our properties. |
| · | Existing tenants might not renew their leases. |
| · | Portions of buildings could remain vacant for extended periods. |
| · | We are subject to the risk that our tenants may default on their obligations, or file for bankruptcy protection. |
| · | Certain of our properties may be specifically suited to the needs of a certain type of tenant, and we may have difficulty leasing such properties in the event of a vacancy. |
Any of these circumstances would hurt the Fund financially. If vacancy rates are higher than we expect, we may suffer reduced revenues resulting in less cash available to be distributed to Investors. In addition, the resale value of a property with vacancies could be decreased because the value of a property may depend on the value of the leases of such property.
Operating Expenses: The costs of operating real estate – including taxes, insurance, utilities, and maintenance – tend to move up over time. We have limited control over some of our operating costs, and if our costs increase it may reduce the amount available for distribution to investors.
Page | 5
Unit Rehabilitation and Capital Improvements: To retain and attract tenants at favorable rental rates, the Fund may be required to expend substantial funds for tenant improvements and refurbishments. Although we expect to maintain sufficient reserves and/or borrowing capacity for these purposes, these resources might not be adequate. If we have insufficient resources to fund tenant improvements, we may be unable to meet our investment objectives, which could reduce the amount of distributions to Investors.
Risks Associated with Development and Construction: We might renovate properties or engage in other real estate development activities from time to time, if consistent with our overall investment strategy. Development and construction can be time-consuming and are fraught with risk, including the risk that projects will be delayed or cost more than budgeted.
Risks Associated with Relying on Third Parties: We expect to engage third parties to provide essential services to the Fund, including, without limitation, on-site property management and construction. If a third party we retain performs poorly or becomes unable to fulfill its obligations, the Fund’s business could be severely disrupted and our financial condition could be adversely affected. Disputes between us and our third party service providers could disrupt our business and may result in litigation or other forms of legal proceedings (e.g. arbitration), which could require us to expend significant time, money and other Fund resources, which could adversely affect the Fund’s financial position. We might also be subject to, or become liable for, legal claims by our tenants or other parties relating to work performed by third parties we have contracted with, even if we have sought to limit or disclaim our liability for such claims or have sought to insure the Fund and its affiliates against such claims.
Unreliable Financial Projections: We have prepared financial projections reflecting what we believe are reasonable assumptions concerning the conduct of our business. However, the nature of real estate development and investment is such that at least some of our assumptions are likely to be mistaken, either for better or for worse, so that the actual results of investing in the properties are likely to be different than the results reflected in the projections, possibly by a wide amount. The real estate industry can be volatile and difficult to predict.
Lack of Diversification: The Fund will invest in only multi-family communities, which is just one of many types of real estate investments (others include commercial, retail, etc.). Furthermore, in the early stages of the Fund’s life, it will own real estate in only a small number of geographic locations. Investors looking for diversification will have to create their own diversified portfolio by investing in other opportunities in addition to the Fund.
Our Ability To Implement Our Investment Strategy Will Depend On the Success of this Offering: Our ability to successfully implement our investment strategy will depend, in part, upon our ability to successfully raise money in this Offering. If we are not successful in raising the maximum amount we have sought in this Offering, we may not have adequate capital to fully implement our investment strategy, which could adversely affect the Fund’s performance.
Changes To Our Investment Strategy: The Manager has broad discretion to change our investment strategy and guidelines at any time without giving prior notice to, or seeking approval from, our Investors.
Page | 6
Inability to Implement Liquidity Transactions: We will typically aim to hold our properties for approximately five years (although certain properties may be held for longer or shorter periods depending on the characteristics of each property and prevailing market conditions), at which point we intend to seek a “liquidity event,” such as a sale or refinancing of the property. However, there is no guarantee that we will be able to successfully pursue a liquidity event with respect to any of our properties. Market conditions may delay or even prevent the Manager from pursuing liquidity events. If we do not or cannot liquidate our real estate portfolio, or if we experience delays due to market conditions, this could delay Investors’ ability to receive a return of their investment indefinitely and may even result in losses, notwithstanding the provisions of the LLC Agreement.
Need for Additional Capital: The real estate industry is capital intensive, and the inability to obtain financing could limit our growth. We may need to raise more money in the future so we can continue to acquire and operate properties. In addition, we might need to raise money to make capital improvements required by law or by market conditions, or for other purposes. There is no guarantee that funding will be available to us when we need it, or on terms that are not adverse to your interests. If we cannot raise additional funding when needed, our operations and prospects could be negatively affected.
Risk of Dilution: If we raise additional capital in the future by issuing equity interests in the Fund, your ownership interest in the Fund would be diluted.
Future Securities Could Have Superior Rights: The Fund might issue securities in the future that have rights superior to the rights associated with the Series A Investor Shares. For example, the holders of those securities could have the right to receive distributions before any distributions are made to Investors, or distributions that are higher, dollar for dollar, than the distributions paid to the holders of the Series A Investor Shares, or the right to receive all their money back on a liquidation of the Fund before the holders of the Series A Investor Shares receive anything.
Risks Associated with Leverage: We intend to borrow money to finance the acquisition of new properties, to pay for the renovation of property, and for other purposes. While debt financing can improve the Fund’s ability to successfully implement its business strategy, debt financing also carries significant risks for Investors because debt service payments will reduce cash available for distribution. Generally, our degree of leverage may also increase our vulnerability to downturns in the real estate market or in economic conditions generally. There is no guaranty that we will generate sufficient cash flow to meet our debt service obligations, and we may be unable to repay, refinance or extend our debt when due. We may also give our lender(s) security interests in our assets as collateral for our debt obligations. If we are unable to meet our debt service obligations, those assets could be foreclosed upon, which could negatively affect our ability to generate cash flows to fund distributions to Investors. We may also be required to sell assets to repay debt, and may be forced to sell at times that are unfavorable to the Fund, which would likewise negatively affect our ability to operate successfully.
Page | 7
Risks of Seller Financing: We might sell a property and finance all or part of the selling price by extending credit to the purchaser in the form of a promissory note. Should a purchaser default, we might not get paid, or might have to spend a substantial amount enforcing the obligation.
The Fund Does Not Have A Credit Rating from Moody’s or Standard & Poor’s: Credit rating agencies, notably Moody’s and Standard & Poor’s, assign credit ratings to debt issuers, which are intended to help investors gauge the ability of the issuer to repay debt. The Fund has not been rated by Moody’s or Standard & Poor’s and, as a result, Investors have no objective measure by which to judge the creditworthiness of the Fund.
Limited Warranties from Sellers: In most cases, the Fund will be required to purchase property in “as is” condition, with few if any representations or warranties by from the seller. If we learn that a property has defects after closing, we may not be able to look to the seller for reimbursement.
Liability for Personal Injury: As a landlord, we may be subject to legal claims for injuries that occur in or outside our properties, e.g., “slip and fall” injuries. Although we expect to maintain our properties in a customary and commercially reasonable manner and to carry insurance against potential liability in amounts we believe are adequate, it is possible that we could suffer liabilities in excess of our insurance coverage or uninsured liabilities.
Environmental Risks: We will conduct typical environmental testing on the properties we acquire to determine the existence of significant environmental hazards. However, it is impossible to be certain of all the ways that properties have been used, raising the possibility that environmental hazards could exist despite our environmental investigations. Under federal and state laws, moreover, a current or previous owner or operator of real estate may be required to remediate any hazardous conditions without regard to whether the owner knew about or caused the contamination. Similarly, the owner of real estate may be subject to common law claims by third parties based on damages and costs resulting from environmental contamination. The cost of investigating and remediating environmental contamination can be substantial, even catastrophic.
ADA Compliance: The Americans with Disabilities Act of 1990 (the “ADA”) requires all public buildings to meet certain standards for accessibility by disabled persons. When constructed or acquired by the Fund, it is anticipated that each property will comply with all current requirements of the ADA. However, if a property is not compliant with all requirements of the ADA and is not “grandfathered” into compliance, or if additional requirements are imposed in the future, whether pursuant to the ADA or otherwise, we would need to make modifications to that property and/or additional expenditures.
Regulation and Zoning: All of the Fund’s properties will be subject to extensive building and zoning ordinances and codes, which can change at any time. Changes in these laws and regulations could affect one or more of our properties adversely.
Page | 8
Casualty Losses: A fire, earthquake, hurricane, mold infestation, or other casualty could materially and adversely affect the operation of one or more properties, even if the Fund carries adequate insurance.
Changes in Laws: Changes in laws, including but not limited to zoning laws, environmental laws, tax laws, or the laws governing how we are allowed to raise money from investors, could harm the Fund and reduce the return to Investors.
Limitation on Rights in LLC Agreement: The Fund’s LLC Agreement limits your rights in several important ways, including these:
| · | The LLC Agreement significantly curtails your right to bring legal claims against management, even if they make mistakes that cost you money. |
| · | The LLC Agreement limits your right to obtain information about the Fund and to inspect its books and records. |
| · | Investors can remove the Manager only in very limited circumstances, even if you think the Manager is doing a bad job. |
| · | The Manager is allowed to amend the LLC Agreement in certain respects without your consent. |
| · | The LLC Agreement restricts your right to sell or otherwise transfer your interest, if the Manager determines that the transfer would jeopardize the status of the Fund as a REIT. |
| · |
The LLC Agreement gives the Manager the right to buy back your Series A Investor Shares without your consent if the Manager determines that (i) the Fund would otherwise become subject to the Employee Retirement Income Security Act of 1974 (after referred to as “ERISA”), (ii) the Fund’s status as a REIT would otherwise be jeopardized, or (iii) you have engaged in certain misconduct.
|
| · |
The LLC Agreement requires that disputes arising under the LLC Agreement be prosecuted in the state or federal courts located in Delaware, which might not be convenient to you.
|
Limitation on Rights in Investment Agreement: To purchase Series A Investor Shares in this Offering, you are required to sign our Investment Agreement. The Investment Agreement limits your rights in several important ways, including these:
| · |
Any claims arising from your purchase of Series A Investor Shares or the Investment Agreement must be brought in the state or federal courts located in Delaware, which might not be convenient to you.
|
| · |
You would not be entitled to a jury trial.
|
| · |
You would not be entitled to recover any lost profits or special, consequential, or punitive damages.
|
Page | 9
Waiver of Jury Trials In Investment Agreement: Our Investment Agreement requires that each Investor waive the right to a trial by jury in a dispute arising from the purchase of his, her, or its Series A Investor Shares. Instead, all such disputes will be tried before a judge. This provision could be unfavorable to an Investor to the extent a judge would be less likely than a jury to find in favor of the Investor. It is possible that a judge would find this provision unenforceable and grant a jury trial to an investor.
Forum Selection Provision In Investment Agreement: Our Investment Agreement provides that any dispute arising from the purchase of Series A Investor Shares will be handled solely in the state or federal courts located in Delaware. We included this provision primarily because (i) the Fund and its Manager are limited liability companies organized under the laws of the State of Delaware, (ii) Delaware courts have developed significant expertise and experience in corporate and commercial law matters and investment-related disputes (which typically involve very complex legal questions), particularly with respect to alternative entities (such as LLCs), and have developed a reputation for resolving disputes in these areas in an efficient manner, and (iii) Delaware has a large and well-developed body of case law in the areas of corporate and alternative entities law and investment-related disputes, providing predictability and stability for the Fund and its Investors. This provision could be unfavorable to an Investor to the extent a court in a different jurisdiction would be more likely to find in favor of an Investor, or be more geographically convenient to an Investor. It is possible that a judge would find this provision unenforceable and allow an Investor to file a lawsuit in a different jurisdiction.
Conflicts of Interests: Our interests could conflict with your interests in a number of important ways, including these:
| · |
The Fund itself has no employees. The Fund is externally managed by the Manager, which is an affiliate of our Sponsor and will rely on our Sponsor’s executive management and real estate professionals. Your interests might be better served if our management devoted its full attention to maximizing the value of the assets purchased by the Fund. Instead, our management will be managing the assets and liabilities of other companies, some of which may compete directly with the Fund. For more information, including how we will attempt to manage such conflicts, please refer to the “Allocation of Expenses and Investment Opportunities” section beginning on page 65.
|
| · | Our Sponsor and its affiliates, including the individuals who will be responsible for managing the Fund, will have business interests wholly unrelated to the Fund, all of which will require a commitment of time. |
| · | Although we will always seek to establish terms that are fair to the Fund, the terms of the Management Agreement were negotiated between related parties, and therefore may not be as favorable to the Fund as if they had been negotiated between unrelated third parties. |
Page | 10
| · | The Manager will receive fees based, indirectly, on the amount of capital we raise in this Offering, and will also receive fees based on the value of the property the Fund acquires, the value of property the Fund sells, the rental income the Fund receives, and the amount of financing the Fund obtains. In each instances, these fees may introduce incentives for the Manager to take actions (e.g., raising and deploying capital) that may not necessarily be in the best interests of Investors. |
| · | The property acquisition and disposition fees payable to the Manager may, to some extent, give the Manager an incentive to buy or sell more properties, even when such purchases or sales might be disadvantageous to the Fund. Likewise, our construction management fees may give the Manager an incentive to engage in construction and development activities with respect to our properties even when such activities might be disadvantageous to the Fund. |
| · | If the Fund invests in a Joint Venture, the Manager will receive fees from the Fund and might also receive fees directly from the Joint Ventures. This could give the Manager an incentive to target Joint Venture opportunities rather than direct investments, even when doing so might not necessarily be in the best interests of Investors. |
| · | The Manger will be entitled to a monthly fee equal to 5% of the gross rents collected, and in turn will required to pay for the services of one or more reputable third-party property-management companies. The Manager might have an incentive to hire a sub-par property-management company, to make a profit on the “spread.” |
| · |
Our Sponsor and its affiliates might not invest significant equity in the Fund. If they do not, their economic interests could be in conflict with the interests of Investors.
|
| · | We may buy assets from or sell assets to affiliates of our Sponsor. Although we will always seek to establish a fair, arm’s-length price for assets, the interests of our Sponsor and its affiliates may be adverse to the Fund’s interests (and thus your interests as an Investor). |
| · | The lawyers who prepared the Fund’s LLC Agreement, the Investment Agreement, and this Offering Statement represent us, not you. You must hire your own lawyer (at your own expense) if you want your interests to be represented. |
No Market for the Series A Investor Shares; Limits on Transferability: There are several obstacles to selling or otherwise transferring your Series A Investor Shares:
| · | There will be no established market for your Series A Investor Shares, meaning you could have difficulty finding a buyer. |
Page | 11
| · | Under the LLC Agreement, the Series A Investor Shares may not be transferred if the Manager determines that the transfer could jeopardize the status of the Fund as a REIT. |
| · | To qualify as a REIT, the LLC Agreement limits the amount of the Fund that any one person may own, which may restrict your ability to sell Series A Investor Shares to others who have invested in the Fund. |
Taking all that into account, you should plan to own your Series A Investor Shares indefinitely.
Our Sponsor’s Track Record Does Not Guaranty Future Performance: The section captioned “Past Performance: Our Track Record So Far,” starting on page 41, illustrates the performance of comparable investment programs sponsored by our Sponsor. However, there is no guaranty that the Fund’s performance will be similar. The economy as a whole and the real estate market in particular have been very favorable to date; economic conditions may change and we might not be able to adapt.
Investors Can’t See Our Actual Investments Before Investing: As of the date of this Offering Circular, the Fund doesn’t own any real estate assets. As a result, investors cannot see or evaluate our assets before making an investment decision. Instead, investors are asked to invest first, then trust that their money will be used wisely.
The Fund Stands On Its Own: The Fund will either succeed or fail on its own account. Although certain affiliates of the Fund have been successful, there is no guaranty that the Fund will be successful. Further, neither the Sponsor, Manager, nor any other person or entity, has committed to provide financial assistance to the Fund should such assistance become necessary.
Uninsured Losses: We will decide what kind of insurance to purchase, and in what amounts. However, some risks cannot be insured at all, or cannot be insured on an affordable basis, and the Fund might not be able to purchase or afford all the insurance it needs. Therefore, the Fund could incur an uninsured loss.
Regulation as an Investment Company: If the Fund were treated as an “investment company” under the Investment Company Act of 1940, we would be required to comply with a number of special rules and regulations and incur significant cost in doing so, which could impair our ability to make distributions in respect of the Series A Investor Shares. If we failed to comply with these special rules and regulations, we could be prohibited from operating our business and subject to civil and criminal liability, and any contracts we were a party to might be unenforceable. We intend to conduct our business so that we are not treated as an investment company, which may limit the manner in which we may operate. However, we might not be successful in avoiding regulation as an investment company. See the “Investment Company Act Limitations” section starting on page 57 for more information.
Reduced Disclosure Requirements Under the JOBS Act: The Series A Investor Shares are being offered pursuant to Tier 2 of Regulation A issued by the SEC, as amended pursuant to the Jumpstart Our Business Startups Act of 2012 (known as the “JOBS Act”). Regulation A does not require us to provide you with all of the information that would be required in a registration statement in connection with an initial public offering (IPO) of securities. As a Regulation A issuer, we are also not subject to the same level of ongoing reporting obligations as a typical public reporting company, including, but not limited to, many of the disclosure requirements applicable to public reporting companies under the Securities Exchange Act of 1934.
Page | 12
We Are an “Emerging Growth Company” Under the JOBS Act: Today, the Fund qualifies as an “emerging growth company” under the JOBS Act. If the Fund were to become a public company (e.g., following an IPO) and continued to qualify as an emerging growth company, it would be able to take advantage of certain exemptions from the reporting requirements under the Securities Exchange Act of 1934 and exemptions from certain investor protection measures under the Sarbanes Oxley Act of 2002. Using these exemptions could benefit the Fund by reducing compliance costs, but could also mean that investors receive less information and receive fewer protections than they would otherwise. However, these exemptions – and the status of the Fund as an “emerging growth company” in the first place – will not be relevant unless the Fund becomes a public reporting company, which we do not plan or foresee.
We Are Not Subject to the Corporate Governance Requirements that Apply to Companies Listed on a National Exchange: Companies whose securities are listed on a national stock exchange (for example, the New York Stock Exchange) are generally subject to a number of rules about corporate governance that are intended to protect investors. For example, the major U.S. stock exchanges require listed companies to have an audit committee made up entirely of independent members of the board of directors (i.e., directors with no material outside relationships with the company or management), which is responsible for monitoring the Fund’s compliance with the law. As of the date of this Offering Statement, neither the Series A Investor Shares, nor any other securities of the Fund, are listed on a national exchange, and it is possible that our securities will never be listed on a national exchange. Accordingly, you may not have the same protections afforded to stockholders of companies that are subject to all of the corporate governance requirements of a national exchange.
Failure to Satisfy Conditions of REIT; Taxes on REITs: We intend to elect to be taxed as a real estate investment trust, or “REIT,” under Sections 856 through 860 of the Internal Revenue Code (the “Code”) for purposes of federal income taxes. To qualify as a REIT, the Fund must satisfy a number of criteria, both now and on an ongoing basis. Should the Fund fail to satisfy any of these criteria, even inadvertently, it could become subject to penalty taxes and/or lose its REIT status altogether, which would make the Fund subject to federal income tax and thereby reduce the returns to investors substantially. Further, even if it maintains its REIT status, the Fund could be subject to various taxes in some situations. While the Fund intends to seek guidance from tax advisors and operate its business accordingly, there is no guaranty that it will be able to avoid taxes and maintain its qualification as a REIT.
We Have Limited Experience Operating a REIT: The Manager has limited experience operating a REIT, which could negatively affect our ability to execute our business strategy, qualify as a REIT, and maintain that status.
Page | 13
REIT Requirements Could Restrict Actions: REITs are subject to a 100% tax on income from “prohibited transactions,” which include sales of assets that constitute inventory or other property held for sale in the ordinary course of a business, other than foreclosure property. This 100% tax could impact our desire to sell assets and other investments at otherwise opportune times if we believe such sales could be considered a prohibited transaction.
Required Distributions: As a REIT, we generally must distribute 90% of our annual taxable income to our investors. From time to time we might generate taxable income greater than our net income for financial reporting purposes from, among other things, amortization of capitalized purchase premiums, or our taxable income might be greater than our cash flow available for distribution to our stockholders. If we do not have other funds available in these situations, we might be unable to distribute 90% of our taxable income as required by the REIT rules. In that case, we would need to borrow funds, sell a portion of our investments, potentially at disadvantageous prices, or find another alternative source of funds. These alternatives could increase our costs or reduce our equity and reduce amounts to invest in real estate assets and other investments. Moreover, the distributions received by our stockholders in such an event could constitute a return of capital for federal income tax purposes, as the distributions would be in excess of our earnings and profits.
Federal and State Income Taxes as a REIT: Even if the Fund qualifies and maintains its qualification as a REIT, it may be subject to federal income taxes and related state taxes. For example, if we have net income from a “prohibited transaction,” such income will be subject to a 100% tax. The Fund may not be able to make sufficient distributions to avoid excise taxes applicable to REITs. The Fund may also decide to retain income it earns from the sale or other disposition of its property and pay income tax directly on such income. In that event, the Fund’s investors will be treated as if they earned that income and paid the tax on it directly. However, shareholders that are tax-exempt would have no benefit from their deemed payment of such tax liability. The Fund may also be subject to state and local taxes on its income or property. Any federal or state taxes paid by the Fund will reduce the Fund’s operating cash flow and cash available for distributions.
Risk Related to Joint Ventures: We may from time to time enter into joint ventures with financial partners selected by the Manager (see “The Fund – Joint Ventures” starting on page 20). We may rely on our real estate venture partners for a variety of matters, including, without limitation, financing, property development services, and property management services. Our real estate venture partners may have financial, business or other interests that are inconsistent with the interests of the Fund (and thus your interests as an Investor), including interests with respect to the acquisition, financing, sale or refinancing of a property, or the timing of such activities. In some instances, our real estate venture partners may have business interests that compete directly against the Fund. If our real estate venture partners perform poorly or become unable to fulfill their obligations in the joint venture, whether due to financial problems, personnel issues, operational issues, or any other reason, the Fund could be adversely affected. Disputes between us and our real estate venture partners may result in litigation or other forms of legal proceedings (e.g., arbitration), which could require us, the Manager to expend significant time, money and other Fund resources, and may adversely affect the Fund’s financial position.
Page | 14
Breaches of Security: It is possible that our systems would be “hacked,” leading to the theft or disclosure of confidential information our investors, tenants, suppliers, and other parties have provided to us. Because techniques used to obtain unauthorized access or to sabotage systems change frequently and generally are not recognized until they are launched, we and our vendors may be unable to anticipate these techniques or to implement adequate defensive measures.
FIRPTA Tax on Non-U.S. Sellers: A non-U.S. Investor who sells Series A Investor Shares for a gain would generally be subject to tax under the Foreign Investment in Real Property Tax Act (FIRPTA) if the Fund does not qualify as a “domestically controlled REIT,” meaning a REIT in which less than 50% of the value of the outstanding shares are owned by non-U.S. persons. We intend to qualify as a domestically controlled REIT, but there can be no assurance we will always do so.
Political Uncertainty: The election of Donald Trump has introduced an element of uncertainty to the political and economic landscape. Because Mr. Trump was previously a real estate developer, some believe his economic policies will favor the real estate industry, a positive for the Fund. However, the first weeks of his presidency also suggest a significant element of uncertainty regarding policy, and markets generally do not perform well during times of uncertainty.
The Foregoing Are Not Necessarily The Only Risks Of Investing
Please Consult With Your Professional Advisors
Please Consult With Your Professional Advisors
Page | 15
THE FUND
Investment Strategy
Summary of Investment Strategy
Like other real estate properties, multi-family apartment communities are typically graded as “A,” “B,” or “C,” with “A” the highest in quality and “C” the lowest. In its simplest form, our investment strategy is to:
| 1) | Identify C-quality multi-family apartment communities in A- or B-quality locations; |
| 2) | Buy those communities for C-level prices; |
| 3) | Make physical alterations and other improvements to those communities, increasing the quality from C to B or even A; |
| 4) |
Foster a social and environmentally friendly sense of community;
|
| 5) |
As a result of the alterations and improvements, attract more qualified tenants;
|
| 6) |
Increase rents accordingly; and
|
| 7) |
Enjoy the resulting cash flow and capital appreciation.
|
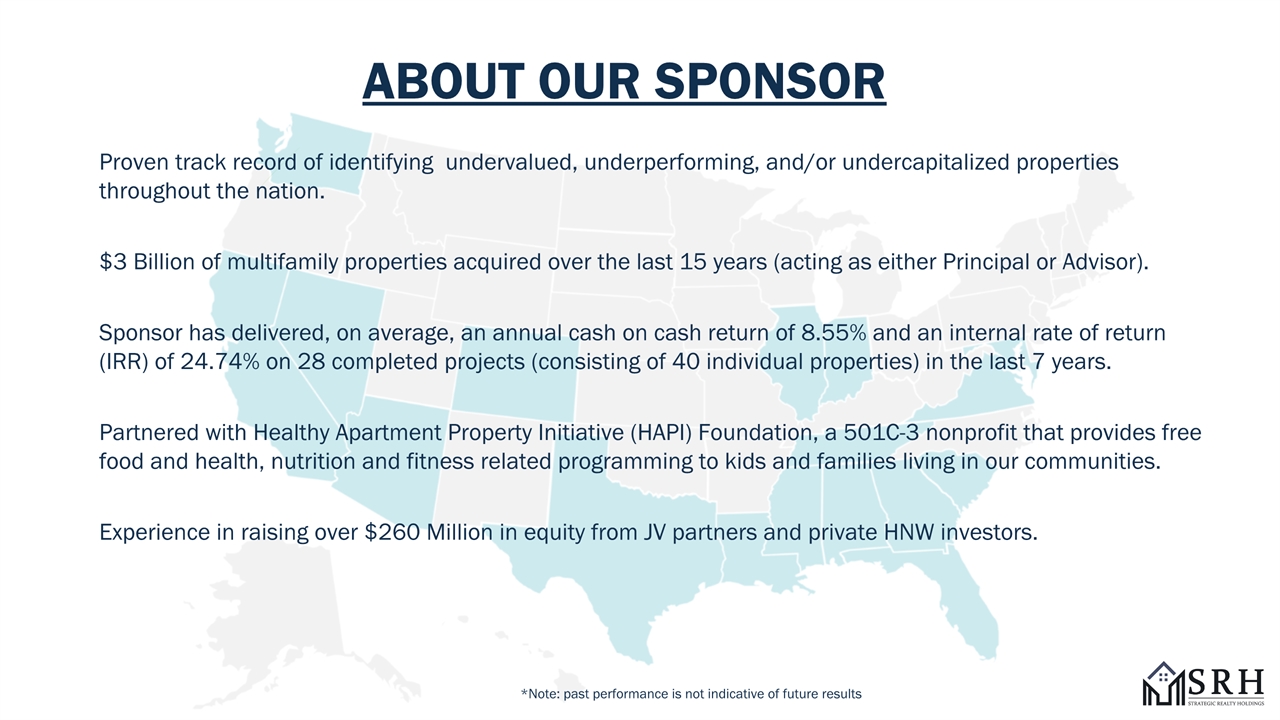
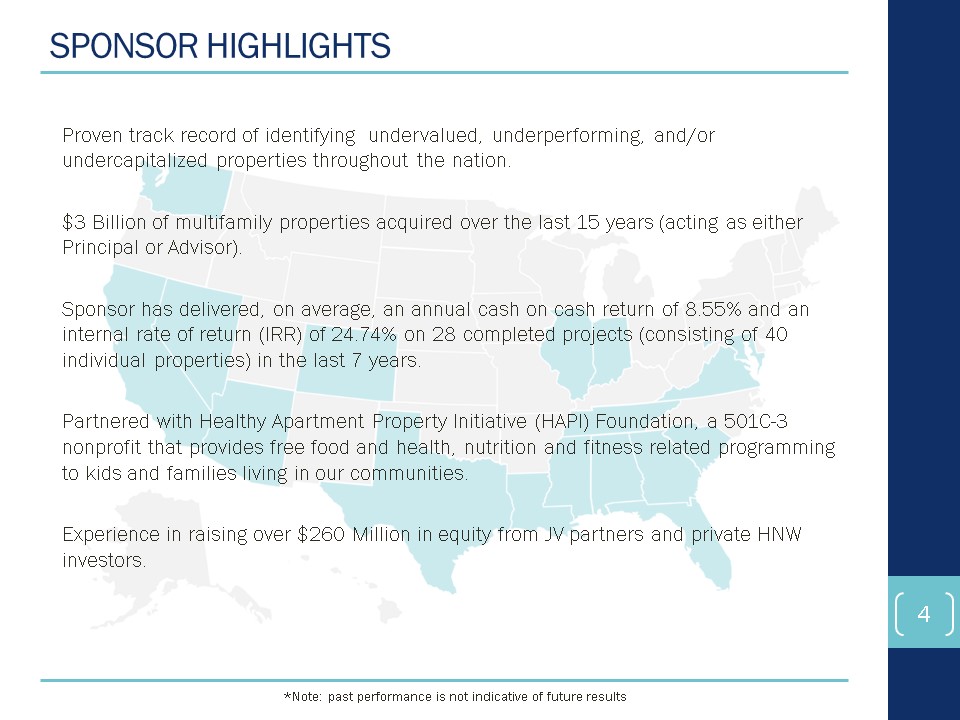
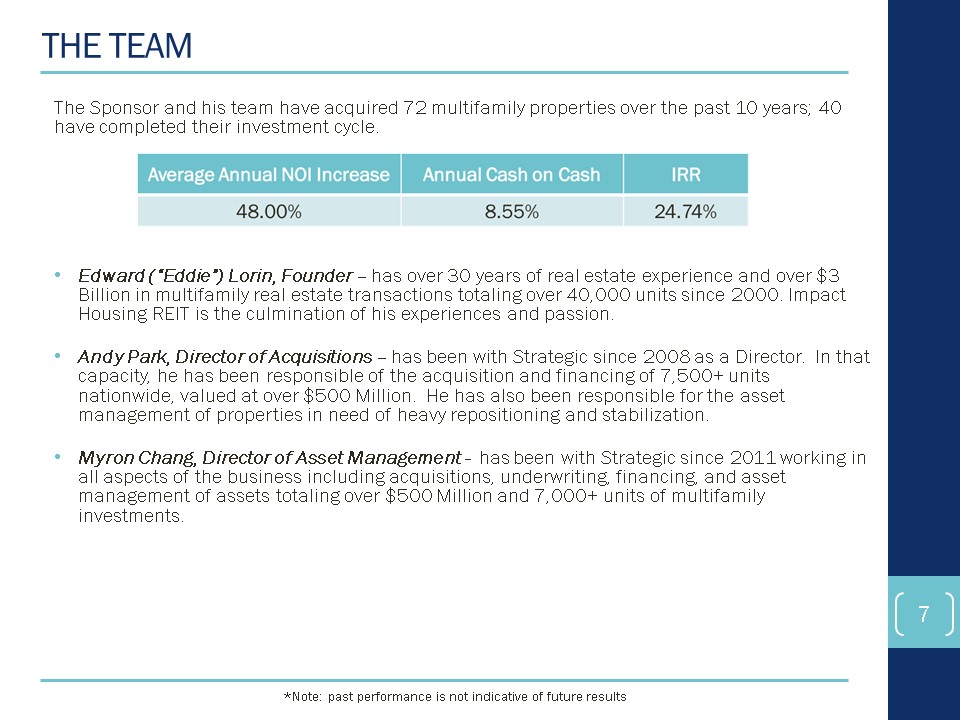
Implementing this strategy, our Sponsor has acquired 72 multifamily properties over the past 9 years, in 39 groups of properties, each corresponding to a separate offering of securities. We refer to each group as a “Project.” Of the 39 Projects we launched, 28 Projects – consisting of 40 separate properties – have completed their full investment cycle from acquisition to renovation to rental to sale.
For more information about our Sponsor’s track record, see the “PAST Performance: Our Track Record So Far” section starting on page 41.
This strategy is simple to state, but not easy to implement.
Focus on Underperforming Communities
Typically, we focus on apartment communities in the following categories:
| · | Older properties that have been neglected and require exterior and interior capital improvements. |
| · | Class “A” apartment communities that are underperforming because of owner mismanagement. |
| · | Apartment communities in locations with high barriers to entry or an unfavorable climate for apartment community development. |
Page | 16
| · | Communities that are in close proximity to one another, where we can join the communities together and maximize the operational and marketing efficiencies. |
Geographic Focus
We seek to invest in geographic regions with diverse and active economies and markets that possess strong prospects for sustained long-term economic growth. Our target markets generally exhibit the following characteristics:
| · | Job growth above the national average |
| · | Population growth above the national average |
| · | Decreasing rent concessions |
| · | Market-specific barriers to entry |
| · | High occupancy rates |
| · | Diverse local economies |
| · | Recovering economies experiencing high growth |
Demographic Focus
We believe that changing demographics will have a significant impact on the apartment industry during the next two decades, and specifically that the following demographic shifts will favor apartment communities:
| · | Increases in the number of young people entering the workforce and creating households over the next 10 to 15 years |
| · | Increases in the number of single-parent households |
| · | Increases in housing expenditures by college-aged tenants who seek to exhaust available funds in tax-favored college savings plans, such as “529 plans” |
| · | The desire of older tenants to live closer to major university hospitals and educational facilities |
| · | Shifts away from the suburbs and to downtown locations |
| · | Increases in the immigrant population. |
Page | 17
Innovative Underwriting Process and Strategic Planning
We underwrite our potential assets differently than many traditional real estate companies. We evaluate the current market position of a potential acquisition as well as its anticipated repositioned competitive performance, and we conduct our analysis with a combination of acquisition specialists and asset managers. Our strategic plan takes into account the following information:
| · | Acquisition cost |
| · | Building restrictions and covenants |
| · | Capital improvement and repositioning budget |
| · | Operating budget |
| · | Current and expected repositioned occupancy |
| · | Current and expected repositioned rents |
| · | Current and repositioned tenant base |
| · | Repositioned net operating income before and after stabilization |
| · | Our ability to install property managers of our choice |
| · | Metrics of other communities in the area |
| · | The condition of the local market |
Impact Investing
The Global Impact Investing Network, or GINN, is a nonprofit organization with headquarters in New York City, dedicated to increasing the scale and effectiveness of impact investing around the world.
GINN defines “impact investments” as “Investments made into companies, organizations, and funds with the intention to generate social and environmental impact alongside a financial return.”
Seeking to generate financial returns for investors and at the same time improve housing conditions for tenants, the Fund intends to operate and hold itself out as an “impact investment” within the GINN definition (neither the Fund nor its Sponsor is a member of GINN).
The most recent GIIN survey found impact investor assets grew by 18% between 2013 and 2015.
Page | 18
One of the Fund’s goals is to identify prime opportunities where lack of existing oversight from an environmental perspective can lead to opportunities for both financial and environmental returns. Often times these scenarios will result in problems such as:
Outdated plumbing and mechanical systems → Leaking/inefficient water usage
Old and inefficient lighting fixtures and systems → Excessive electricity waste
Upon takeover of an asset, the Fund would immediately move towards renovating, upgrading, and/or replacing any physical aspect that is deemed wasteful. Not only would this potentially result in less financial burden to the asset, but set the foundation for a long term and beneficial environmental impact.
In conjunction with various and specialized non-profit organization, the Fund intends to engage in and implement social community programs geared towards a happier and healthy lifestyle. In the past, our Sponsor has worked closely with organizations such as HAPI Foundation, Be A Champion, and other local groups and businesses to bring after-school tutoring, free meals for kids, health and fitness classes, and much more.
As part of its business plan, the Fund intends to team up with appropriate organizations to replicate and roll out as many social and community building programs as possible.
For examples and metrics regarding our Sponsor’s past impact investing improvements and results, please reference Exhibit 1A-15E.
Management of Business and Investments
The business and investments of the Fund will be managed by Impact Housing REIT Manager, LLC, which we refer to as the “Manager.” For more information, including see the “Summary of Management Agreement” section starting on 56. Investors who purchase Series A Investor Shares in the Offering will have no right to participate in management.
The Manager can be removed for “cause.” For more information, see the “Summary of Our LLC Agreement and Authorizing Resolution – Management” section starting on page 58.
Management of Properties
We intend to engage third parties to manage our apartment communities at the property-level.
Our management agreements with third parties are negotiated on an arm’s length basis and include terms that are market for that geographic area or community size. These agreements generally provide that the property manager has control of all operational aspects of the apartment community, including employee-related matters, advertising and rental services, and is reimbursed for all direct and indirect operating expenses. The property manager must generally maintain each apartment community in good repair and condition and make such routine maintenance, repairs and minor alterations as it deems reasonably necessary.
Page | 19
Our management agreements typically provide for an initial term of 12 months, with automatic renewals unless either party gives notice of non-renewal. However, the management agreements are generally terminable by either party without cause upon 30 days’ notice, and may also be terminated immediately upon the occurrence of specified events.
Leverage
We will always borrow money to finance part of the cost when we buy property, and we might also borrow money to finance all or a part of the cost of renovating property. Our guideline – which we can modify based on market conditions, interest rates, and other factors – is to borrow no more than 80% of the purchase price of an apartment community or 75% of the total cost, whichever is less. For example, if we buy a community for $5 million and plan to spend another $500,000 on renovations, then 80% of the cost would be $4 million while 75% of the total cost would be $4,125,000. In this case we would typically limit our borrowing to $4 million.
In some cases – again depending on a number of factors, including what we believe is the predictability of the cash flow a project is expected to generate – we could even borrow up to 90% of what we believe to be the value of a project. This would normally be through a separate “mezzanine” financing facility.
We typically borrow from banks or other institutional lenders.
Joint Ventures
Usually, the Fund or a wholly-owned subsidiary will buy a direct fee simple interest in real estate. Occasionally, however, we might make indirect investments in real estate through on or more joint ventures with third parties (we refer to these as “Joint Ventures”). A typical Joint Venture would involve forming a partnership or limited liability company with the Fund as one owner and one or more third parties as the other owners. Each owner, including the Fund, would contribute capital, financing, know-how, and/or other assets to the Joint Venture. The Joint Venture itself would buy the direct fee simple interest in the real estate.
Normally, but not always, the Fund or the Manager will serve as the managing member, general partner, or equivalent of the Joint Venture and thereby retain ultimate managerial control.
Competition
The Competitive Landscape
We face intense competition in finding apartment communities and attracting tenants to our communities. In identifying and acquiring apartment communities, we compete with insurance company, pension and investment funds, partnerships and investment companies, other REITs, family offices, and other individual and institutional investors, many of whom have more capital and other resources than we do. As an owner and operator of apartment communities, we face competition not only from other communities, but also from condominiums and single-family houses. Squeezed at both ends, the intense competition can have the effect of increasing property acquisition prices while lowering the rental rates we charge our tenants.
Page | 20
Our Competitive Advantages
Experience: Our management team has many years of dedicated experience searching for apartment communities that we believe have unrealized value. Since 2001, our management team has acquired more than $1.0 billion in apartment communities on its own behalf and another $2.0 billion on behalf of private investors, amounting to more than 180 communities with more than 40,000 apartment units. We have built our portfolio through primarily single-asset acquisition transactions because we believe that most portfolio sales include assets that do not meet our investment criteria. Single-asset transactions require careful market research and asset underwriting. In addition, because our predecessor business operated at very high debt-to-assets leverage ratio, we are disciplined in our underwriting and acquisitions and thorough in our projections of an asset’s repositioned performance.
We have contacts and established relationships with owners, operators, lenders, brokers, service providers and consultants, and property management companies across the country that allow us to more quickly identify and underwrite a potential apartment community acquisition. These contacts often allow us to identify acquisition opportunities before the opportunities are broadly marketed. Our professionals receive daily updates from their contacts regarding potential property acquisitions meeting our investment criteria. For example, our management team identified, through its contacts with third-party management companies, and we acquired 48 of our 180 apartment communities before those properties were auctioned or widely marketed by real estate brokers.
Ability to Move Quickly: We are an entrepreneurial company with the flexibility to move quickly when an opportunity presents itself. We believe that employing highly qualified industry professionals allows us to better achieve this objective. We rely on our deal and asset managers to identify suitable apartment communities for acquisition and the commitment to acquire an asset is swift. Decisions to purchase properties are not hampered by multiple layers of decision makers. Once under contract to purchase, our aggressive deal and asset management teams conduct market research including current rental comparisons and trends to verify our value-add strategy. We believe that our corporate agility has allowed us to beat larger and better capitalized organizations to emerging markets and assets priced below market.
Proven Turnaround Ability: Our in-house team has a track record of acquiring and turning around underperforming apartment communities and positioning them to compete with targeted upscale apartment community competitors.
The Right Approach: We believe our value-add strategic vision is more cost-efficient than ground-up development and maximizes risk-adjusted returns to our stockholders because (i) we acquire operating assets with a stream of income from current tenant leases, (ii) our communities are not subject to the complex entitlement process associated with development projects, (iii) our renovation and repositioning projects are less costly and less susceptible to construction delays than ground-up development, and (iv) the bulk of our investment returns are generated from the unrealized value in a property rather than market-driven annual rent increases.
Page | 21
Our Operating Strategies
Reposition Tenant Base
Key to our success is acquiring “C” quality communities in “A” or “B” quality locations and, over the course of six to 18 months, repositioning our tenant base consistent with “A” or “B” quality communities. This allows us to increase rents, creating instant value for our investors.
We typically upgrade our tenant base in two ways: tightening our tenant application procedures and improving the physical appearance of the property, consistent with the amenities and features that higher-quality tenants expect.
Outsource Property Management
We typically outsource property-level management to larger regional or national firms. We try to use the same property manager for multiple properties within a given geographic area to increase efficiencies.
Outsourcing property management has allowed us to:
| · | Focus on underwriting and acquisitions |
| · | Concentrate on developing and reviewing each community’s strategic renovation and repositioning plan |
| · | Deploy our capital primarily for acquisitions and the related renovation and repositioning projects |
| · | Obtain economies of scale |
| · | Take advantage of the expertise of our property managers in evaluating other opportunities |
| · | Identify “off market” opportunities |
| · | Manage our communities consistent with each community’s operating budget and strategic plan |
Actively Manage Our Communities
Once we acquire a community, we seek to manage the community in accordance with a strategic plan developed during pre-acquisition due diligence. Our strategies include:
| · | Tenant surveys |
| · | Focus on tenant satisfaction |
| · | Staggered lease terms |
Page | 22
| · | Emphasize higher occupancy rates, increasing rents as market conditions permits |
| · | Charging higher rates for units with more amenities |
Control Operating Expenses
We control operating expenses in a variety of ways, including:
| · | We concentrate our communities within the same markets |
| · | We combine the operations of communities that are in close proximity to each other |
| · | We use purchase order controls, acquiring goods and services from pre-approved vendors |
| · | We purchase supplies in bulk where possible |
| · | We bid third-party contracts, including insurance, on a volume basis to regional and national community managers with whom we have established relationships |
| · | We aggressively manage our renovation and repositioning programs |
| · | We bid our insurance coverage on a volume basis |
| · | We strive to retain residents through high levels of service |
| · | We undertake preventive maintenance regularly |
| · | We aggressively pursue real estate tax appeals |
| · | We are “green” apartment owners and use energy efficient devices to lower utility costs |
Use Technology
We use and continuously seek ways to improve technology applications to help manage our communities. To capitalize on that strategy, we have commenced a major upgrade to our accounting and operational data systems. This integrated system will provide the platform to allow our third-party management companies to upload property-level operating data on a real-time basis to our corporate office where our asset managers and other professionals will synthesize the data to more quickly and efficiently evaluate each community’s performance. This system will implement a standardized report format for each of our properties. We are working closely with our third-party management companies to have this system operational across our portfolio.
Page | 23
Our external leasing professionals also benefit from a streamlined electronic intake system. Through directed internet marketing, we encourage prospective tenants to provide information about their amenity preferences and residence budget. Our leasing professionals use this information to customize their presentations to prospective and existing tenants who are considering lease renewal options. By providing a convenient means for potential tenants to provide us key information, we are able to efficiently match their needs with our available apartment units.
Possible Commercial Component
Occasionally, a residential building or community the Fund buys will include a commercial component. For example, an apartment building might have retail stores, or a gym, or a coffee shop, on the first floor (street level). Measured by gross rents, the commercial component of a building rarely exceeds 20% of the total.
Disposition of Properties
We may dispose of properties by sale for cash or upon other terms as determined by the Manager. For example, we might also accept purchase money obligations or other properties in exchange for an existing investment. We may also dispose of less than all of our ownership interest in some situations.
Generally, we will engage outside brokers to market a property rather than relying on direct sales coordinated internally. In our experience, listing with experienced outside brokers, while increasing transaction costs, maximizes disposition values on a consistent basis. In addition, developing relationships with key brokers in local markets helps to keep us current on local market changes and allows us to receive information on potential acquisition properties before they are widely marketed.
Term of the Fund
We will begin deploying the capital we raise in this Offering once we have raised at least $3,000,000, which we refer to as the “Initial Closing Date.” We intend to operate the Fund for a period of approximately five years from the Initial Closing Date, with the option of up to two additional one-year extensions at the discretion of the Manager.
To wind down the Fund, the Manager will seek to generate liquidity for Investors and realize any gains in the value of our investments by selling or refinancing our properties and returning capital to Investors on an orderly basis. Sales and refinancing will be subject to prevailing market conditions and there is no guarantee that we will be successful in executing any such liquidity transactions on terms favorable to the Fund and Investors, or that we will be able to do so within the time frame we have anticipated.
Page | 24
SUMMARY OF INVESTMENT OPPORTUNITY UNDER REVIEW

The Fund is currently evaluating its first potential investment – a 143-unit value-add high rise apartment community in Silver Spring, Maryland, in the Washington, D.C. metro area. The property is known as Waterford Tower and is located at 14000 Castle Boulevard, Silver Springs, Maryland 20904. The Fund is conducting its due diligence review of this acquisition opportunity and the terms of any acquisition have not been set. We believe this acquisition could close in the second quarter of 2018, although we cannot guaranty when (or if) this transaction will ultimately close or on what terms. At this time, we believe the investment would be structured as a joint venture between the Fund and a third-party joint venture partner, and as of the date of this Offering Circular we are in talks with potential joint venture partners. As with the terms of the acquisition, the exact terms of any joint venture have not been determined as of the date of this Offering Circular. At this time, we anticipate that the Fund would contribute approximately $3 million in equity and the joint venture partner would contribute approximately $5 million in equity toward this project, and that the Fund’s Manager would maintain exclusive management control over the joint venture, although we cannot guarantee these or any other terms (or that we will pursue this joint venture at all). Other material terms of the joint venture and of the contemplated acquisition (including, but not limited to, the price and other terms of the acquisition, the utilization of debt financing (leverage), the economic terms of the joint venture, and the governance rights of our joint venture partner) are still to be determined.
Page | 25


Page | 26


Page | 27


Page | 28
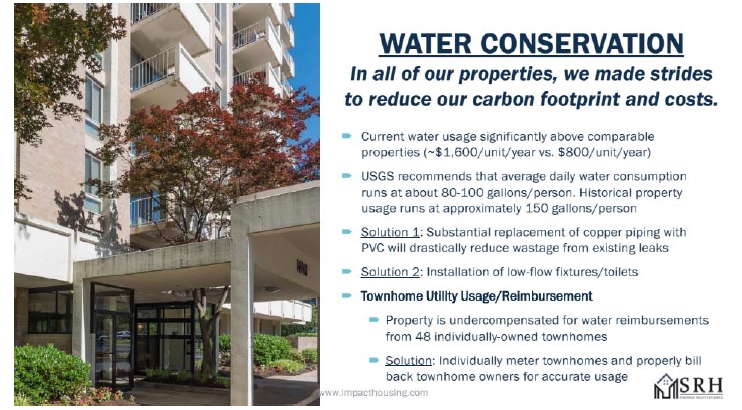
Page | 29
WHAT IS A REIT, ANYWAY?
The Fund intends to be treated as a Real Estate Investment Trust, or “REIT.”
A REIT is just a tax concept: an entity that is treated as a corporation for Federal income tax purposes and satisfies a long list of requirements listed in section 856 of the Internal Revenue Code. These requirements include:
| · | The kinds of assets it owns |
| · | The kind of income it generates |
| · | Who owns it |
| · | How much of its income it distributes to its owners |
A REIT is not a function of securities laws. Thus, many REITs have “gone public” by offering their securities in offerings that are registered under the Securities Act of 1933, while many other REITs are still private. Some “public” REITs have registered their shares on a national securities exchange, allowing the shares to be publicly traded, while the shares of other “public” REITs are traded privately. There are very large REITs and very small REITs, and everything in between. Some REITs invest in one class of real estate assets, others invest in completely different classes of real estate assets (e.g., only mortgages), and still others invest in multiple classes of real estate assets. The only thing all these companies have in common, being REITs, is that they all satisfy the requirement in section 856 of the Code.
Why go through the headache of satisfying all those rules to become a REIT? Just taxes:
| · | If the Fund were a regular limited liability company, not a REIT, then the income of the Fund would be reported to Investors on Form K-1. Transferring the information from Form K-1 to his or her own personal tax return can be difficult and time-consuming. |
| · | Conversely, if the Fund were a corporation and did not qualify as a REIT, it would be subject to tax on its income at the corporate level, and investors would then be subject to tax again when the Fund distributed its income, resulting in two levels of tax on the same income. |
| · | As a REIT, the Fund will not itself be subject to tax, and Investors will receive only a simple Form 1099 to report their income from the Fund. |
If you are interested, you can read much more detailed information about the tax treatment of REITs in the “Federal Income Tax Consequences” section starting on page 68.
The Fund is a limited liability for purposes of state law, but has elected to be treated as a corporation for Federal income tax purposes. That’s what allows the Fund to be treated as a REIT.
Page | 30
OUR ORGANIZATIONAL STRUCTURE
When Investors buy Series A Investor Shares, they are buying an interest in Impact Housing REIT, LLC, which is a Delaware limited liability company that has made an election to be taxed as a corporation (and as a REIT) for Federal income tax purposes. We refer to that company as the “Fund.”
Apart from Investors, the only other owner of the Fund today is Impact Housing REIT Manager, LLC, also a Delaware limited liability company. We refer to this company as the “Manager.” The Manager controls all of the aspects of the Fund’s business and operations, including investment decisions (that is, deciding which properties to buy and sell and when to buy and sell them). The Manager is owned by Mr. Lorin or an entity that he controls.
Of course, the Fund could admit additional members in the future.
The following diagram illustrates the organizational structure of the Fund, where Investors are included in the box at the right:
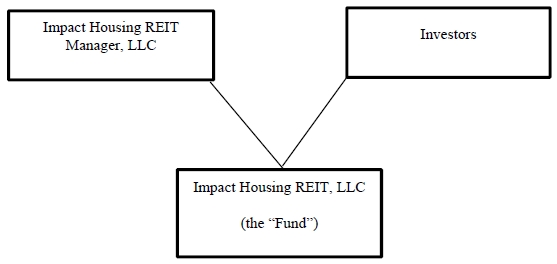
Page | 31
OUR MANAGEMENT TEAM
Neither the Fund nor the Manager has any employees. Instead, the Manager will act for and on behalf of the Fund through the employees and management team of our Sponsor.
The key employees of our Sponsor are:
|
Name
|
Position
|
Age
|
|
Edward P. Lorin
|
CEO/Founder
|
51
|
|
Myron Chang
|
Director of Asset Management
|
28
|
|
Andy Park
|
Director of Acquisitions
|
33 |
Edward P. Lorin
The principal of the Manager is Edward P. Lorin, who has been managing director of JEM Realty Advisors, a property acquisition and asset management advisory firm, since 2001. During his 28-year career, Mr. Lorin has been responsible for the acquisition of more than $3.7 billion in office, industrial and apartment community assets.
Mr. Lorin founded Strategic Realty Holdings, LLC as a culmination of his over 25 years’ experience in investment real estate and as an offshoot of Strategic Realty Capital (SRC). Since 2008, SRC has purchased over 15,000 units in more than 70 transactions valued at over $1.0 billion, and has built a strong performing portfolio. All of SRC’s apartment assets were purchased opportunistically and successfully re-positioned into thriving communities.
Prior to forming SRC, Mr. Lorin was the exclusive acquisition advisor to a large national apartment company, where he led the acquisition of 110 properties; 25,000+ units contained in over $2.2 billion in real estate. Mr. Lorin has also handled over $700 million in transactions involving Class A office buildings and retail space for Douglas Emmett/Jon Douglas Commercial, and has sold various sale-leaseback properties with Damon Raike & Company. Mr. Lorin also spent 8 years in the asset management and development of 5 million square feet of shopping centers and industrial complexes while employed by private, entrepreneurial Los Angeles investors.
Mr. Lorin is also co-founder of the 501II non-profit HAPI Foundation, which was developed to promote health and wellness in apartment communities. Mr. Lorin earned his bachelor’s degree from the University of California, Los Angeles, has a specialized “minor” in investment real estate, and has been a licensed real estate broker since 1988.
Page | 32
Myron Chang
Myron Chang joined Strategic Realty Capital in 2011 working in all aspects of the business including acquisitions, underwriting, financing, and asset management of assets totaling over $500 Million and 7,000+ units of multifamily investments. In 2012, Mr. Chang joined the Asset Management division, overseeing all facets of property operations, ranging from supervising management companies in their daily operations to ensuring the compliance of the properties in all lender related procedures. Mr. Chang received a Bachelor of Science Degree in Mathematics/Economics from the University of California, Los Angeles.
Andy Park
Mr. Park has been a Director in the Acquisitions division of Strategic Realty Capital, since its formation in 2008. In that capacity, he has been responsible for acquiring 7,500+ multifamily units nationwide, valued at over $500,000,000. He has also been responsible for the asset management of properties in need of heavy repositioning and stabilization. Before joining SRC, Mr. Park was an Acquisitions Associate at JEM Realty Advisors from 2004 to 2008, where he helped acquire more than $500,000,000 of multifamily properties, primarily located in several states throughout the East Coast. Mr. Park earned his Bachelor of Arts Degree in Economics from the University of California, Los Angeles, and holds a Real Estate Broker License in the state of California. During his tenure at UCLA, he held internships at MJW Investments and JPMorgan Chase.
Page | 33
COMPENSATION OF MANAGEMENT
Overview
The people who run the Fund make money from the Fund in (only) three ways:
| · | They receive fees |
| · | They invest alongside Investors and receive the same distributions as Investors |
| · | They receive the Promoted Interest |
All three forms of compensation are discussed below.
The Fund itself does not have any employees or payroll. For example, Edward P. Lorin, the Chief Executive Officer of the Manager, does not receive any salary, bonuses, or other compensation directly from the Fund. Instead, all of his compensation is paid from the fees paid to the Manager and from the Promoted Interest. The same is true for all of the other executive officers.
Fees
|
Type of Fee
|
Description
|
|
Reimbursement
|
The Fund must reimburse the Manager for expenses the Manager incurs in connection with the Offering, before the Offering Circular is qualified by the Securities and Exchange Commission.
Estimate: We currently estimate that those expenses will be approximately $300,000.
|
|
Asset Management
|
The Manager will charge the Fund a monthly asset management fee equal to 0.14583% of the Investors’ aggregate capital accounts as of the last day of each calendar month, or approximately 1.75% per year. An Investor’s “capital account” will generally be equal to the amount the Investor paid for his, her or its Series A Investor Shares, less any capital that has been returned to the Investor.
Estimate: The amount of the asset management fee will depend on (i) how much capital is raised in the Offering, and (ii) when and how much capital is returned to Investors. If the Fund raised the maximum $35,000,000, the Manager would receive approximately $612,500 per year. However, we cannot make a reasonable estimate at this time.
|
Page | 34
|
Acquisition of
Property
|
With respect to direct investments in real estate, the Manager will be entitled to receive an acquisition fee equal to 1.5% of the total cost of each property acquired on our behalf, which will be payable in addition to any brokerage or other fees payable to third parties.
With respect to Joint Ventures, the Fund, as the managing member of a Joint Venture, may be entitled to an acquisition fee to the extent negotiated with the financial partners in such Joint Venture (which could be higher than the 1.5% acquisition fee for direct investment), all of which will be payable to the Manager. In addition, the Manager shall be entitled to a 1.0% acquisition fee on the total cost (to the Fund) of the asset, payable upon the closing of the transaction.
Estimate: The amount of the acquisition fee will depend on how much property the Fund buys (either directly or through a Joint Venture), which will in turn depend on how much capital is raised in the Offering and how much leverage the Fund uses. We cannot make a reasonable estimate at this time.
|
|
Property
Management
|
The Fund allocates 5.0% of its gross monthly rents to property management fees, which the Manager believes is a market rate. If the Manager is able to engage a third party property manager for less than 5.0%, the Manager is entitled to retain the difference.
Estimate: The amount of the property management fee will depend on the gross rents the Fund receives and the actual costs of third-party property management services. We cannot make a reasonable estimate at this time.
|
|
Disposition of
Property
|
With respect to direct investments by the Fund, the Manager will receive a disposition fee equal to 1.0% of the total sale price of each property.
With respect to Joint Ventures, the Fund, as the managing member of a Joint Venture, the Manager might be entitled to a similar disposition fee to the extent negotiated with the financial partners in such Joint Venture (which could be higher than the 1.0% disposition fee for direct investment). In addition, the Manager shall be entitled to a 1.0% disposition fee on the final sales price (to the Fund) of the asset, payable upon the closing of the transaction.
Estimate: The amount of the disposition fee will depend on the selling price of assets by the Fund and any Joint Ventures and, in the case of Joint Ventures. The terms our Manager negotiates with our Joint Venture partners. We cannot make a reasonable estimate at this time.
|
Page | 35
|
Financing
|
With respect to direct investments by the Fund, the Manager will be entitled to receive a financing fee equal to 1.0% of the amount of each loan placed on a property, whether at the time of acquisition or pursuant to a refinancing. This financing fee will be in addition to any fees paid to third parties, such as mortgage brokers.
With respect to Joint Ventures, the Fund, as the managing member of a Joint Venture, may be entitled to a similar financing fee of 1.0% to the extent negotiated with the financial partners in such Joint Venture, all of which will be payable to the Manager.
Estimate: The amount of the financing fee will depend on the amount of leverage (debt) the Fund and any Joint Ventures use and, in the case of Joint Ventures. The terms our Manager negotiates with our Joint Venture partners. We cannot make a reasonable estimate at this time.
|
|
Construction
Management
|
The Manager may provide construction and/or construction management services on behalf of the Fund. If so, the Manager shall be entitled to compensation that is (i) fair to the Fund, and (ii) no greater than would be paid to an unrelated party at arm’s length.
Estimate: The amount of the construction management fee will depend on the nature and cost of the construction services the Manager provides. We cannot make a reasonable estimate at this time.
|
|
Other Fees
|
The Company engages third parties to provide a variety of other services, including insurance and marketing. If the Manager is able to engage third parties at lower-than-market rates, then the Manager is entitled to retain the difference.
Estimate: The amount of other fees will depend on the nature of the services the Manager provides and how much the Manager charges for such services. We cannot make a reasonable estimate at this time.
|
Co-Investment
The Manager (and possibly other affiliates of our Sponsor) might purchase Series A Investor Shares. If so, they will be entitled to the same distributions as other Investors.
Page | 36
Promoted Interest
As described in the “Securities Being Offered – Distributions” section beginning on page 45, the Manager is entitled to receive certain distributions that we refer to as the Manager’s “Promoted Interest.” The Promoted Interest is paid in two levels: the first is paid from operating cash flow after Investors have received a cumulative, non-compounded annual return of 7%; and the second level is paid from the proceeds of capital transactions (like sales and refinancing) after Investors have received an internal rate of return of 16%.
How much money the Manager ultimately receives as a Promoted Interest therefore depends on a number of factors, including:
| · | How much capital is raised in the Offering; |
| · | The investment returns the Fund is able to achieve; |
| · | When those returns are achieved (the Fund might not achieve the same return every year); |
| · | When the Fund distributes money to Investors; and |
| · | The amount of expenses the Fund incurs. |
Report to Investors
No less than once per year, the Fund will provide Investors with a detailed statement showing:
| · | The fees paid to the Manager and its affiliates; and |
| · | Any transactions between the Fund and the Manager or its affiliates. |
In each case, the detailed statement will describe the services performed and the amount of compensation paid.
Clawback
If, upon the liquidation of the Fund, the owners of the Series A Investor Shares other than the Manager have not received distributions sufficient to return their capital contributions plus a 7% cumulative, non-compounded annual return, the Manager will be required to return any distributions it has received from the Fund, over and above its actual contributed capital, in an amount such that the Fund can distribute the shortfall to the owners of the Series A Investor Shares, other than the Manager.
Method of Accounting
The compensation described in this section was calculated using the accrual method of accounting.
Page | 37
Stages of Development
The stages of the Fund’s organization, development, and operation, and the compensation paid by the Fund to the Manager and its affiliates during each stage, are as follows:
|
Stage
|
Compensation
|
|
Organization
|
None
|
|
Acquisition of Property
|
· Asset Management Fee
· Acquisition Fee
· Financing Fee
|
|
Operation
|
· Asset Management Fee
· Property Management
· Insurance
· Marketing
· Financing Fee
· Returns from Co-Investment
· Promoted Interest
· Disposition Fee
|
|
Liquidation
|
· Returns from Co-Investment
· Promoted Interest
· Disposition Fee
|
Page | 38
SECURITY OWNERSHIP OF MANAGEMENT
The limited liability company interests in the Fund are denominated by 20,000,000 “Shares,” consisting of 1,000,000 “Common Shares” and 19,000,000 “Investor Shares.” The Manager has the authority to divide the 19,000,000 Investor Shares into one or more “series,” by adopting one or more authorizing resolutions. The Manager adopted the Authorizing Resolution to create the 3,500,000 Series A Investor Shares.
As of the date of this Offering Circular, the limited liability company interests of the Fund are owned as follows:
|
Common
Shares |
Name and address of beneficial
owner |
Amount and nature
of beneficial ownership |
Percent of
class |
|
Impact Housing REIT Manager, LLC (1)
23901 Calabasas Road Suite 2010
Calabasas, CA
93102
|
1,000,000
|
100%
|
|
|
Edward P. Lorin
23901 Calabasas Road Suite 2010
Calabasas, CA 93102
|
0
|
0%
|
|
|
Myron Chang
23901 Calabasas Road Suite 2010
Calabasas, CA 93102
|
0
|
0%
|
|
|
Andy Park
23901 Calabasas Road Suite 2010
Calabasas, CA 93102
|
0
|
0%
|
|
|
Series A
Investor Shares |
Name and address of beneficial
owner |
Amount and nature
of beneficial ownership |
Percent of
class |
|
--
|
--
|
--
|
(1) ) As of the date hereof all of the Fund’s common shares are beneficially owned by the Fund’s Manager, Impact Housing REIT Manager, LLC, which is controlled by its manager, Edward P. Lorin.
Page | 39
MANAGEMENT’S DISCUSSION AND ANALYSIS OF FINANCIAL CONDITION AND RESULTS OF OPERATIONS
Liquidity
The Fund was organized under the Delaware Limited Liability Company Act on August 17, 2016. As of the date of this Offering Circular, we have not yet begun operations other than those associated with general start-up and organizational matters. As of the date of this Offering Circular, we have no revenues.
The Fund is obligated to reimburse the Manager for expenses the Manager incurs in connection with the Offering. We currently estimate that those expenses will be approximately $300,000.
We intend to use the proceeds of this Offering to buy, renovate (where necessary), and operate a portfolio of multi-family apartment communities. We will also use debt (borrow money) to finance a portion of the costs of buying and renovating property. For more information, please see the “The Fund – Leverage” section beginning on page 20.
Apart from our efforts to raise money from the sale of Series A Investor Shares in this Offering, we are not aware of any trends or any demands, commitments, events, or uncertainties that will result in or that are reasonably likely to result in the our liquidity increasing or decreasing in any material way.
Capital Resources
As of the date of this Offering Circular, we have not purchased any apartment communities or other assets or entered into any agreements to do so. Apart from our efforts to raise money via the sale of Series A Investor Shares in this Offering, we are not aware of any material trends, favorable or unfavorable, in our capital resources, or any expected material changes in the mix and relative cost of such resources.
Results of Operations
The Fund is in the development stage and has not yet begun principal operations. We do not intend to begin principal operations until we have received and accepted subscriptions from investors representing at least $3,000,000 of Series A Investor Shares.
Off Balance Sheet Arrangements
As of the date of this Offering Circular, the Fund does not have any off-balance sheet arrangements that have or are reasonably likely to have a current or future effect on our financial condition, changes in financial condition, revenues or expenses, results of operations, liquidity, capital expenditures or capital resources.
Page | 40
PAST PERFORMANCE: OUR TRACK RECORD SO FAR
Summary and Narrative Description
The Sponsor of the Fund is Strategic Realty Holdings, LLC, which we refer to as “SRH.” The principal owner and manager of the Sponsor is Edward P. Lorin.
From 2001 through 2008 Mr. Lorin and his team served as the exclusive advisors to private investors in connection with the purchase, renovation and operation of approximately 110 under-performing apartment communities, acquiring more than $2 billion in real estate. From 2008 to the present, as the sole principal of SRH and one of two principals of Strategic Realty Capital, LLC, which we refer to as “SRC,” Mr. Lorin has purchased another 72 underperforming communities in transactions valued at over $1 billion. Mr. Lorin has managed or purchased apartment communities in California, Nevada, Arizona, Washington, Colorado, Texas, Louisiana, Mississippi, Alabama, Georgia, Tennessee, Florida, North Carolina, South Carolina, Virginia, Illinois, and Maryland.
The 72 communities purchased by Mr. Lorin and his team involved approximately 39 different offerings of securities, raising approximately $260 million from approximately 50 outside investors. We refer to each of these securities offerings and the properties they included as a “Project.”
All of the Projects involved buying residential rental (income-producing) real estate. None of the Projects involved primarily buying commercial real estate (except commercial real estate that was incidental to the primarily residential component of the project), nor building or developing properties from the ground up (i.e., new construction).
All of the Projects are similar to the Fund in the following respects:
| · | They all involve raising money from investors. |
| · | They all involve conducting the same business as the business in which the Fund will be engaged, i.e., investing in underperforming multi-family apartment communities. |
| · |
Each of the Projects also has investment objectives that are identical to the investment objectives of the Fund.
|
Because of these similarities, investors who are considering purchasing Series A Investor Shares from the Fund might find it useful to review information about the Projects. Of course, prospective investors should bear in mind that prior performance does not guaranty future results. The fact that a prior Project has been successful (or unsuccessful) does not mean the Fund will experience the same results.
There have been no major adverse business developments or conditions experienced by any Project that would be material to purchasers of the Fund’s Series A Investor Shares.
Page | 41
None of the Projects:
| · | Has been registered under the Securities Act of 1933; |
| · | Has been required to report under section 15(d) of the Securities Exchange Act of 1934; |
| · | Has had a class of equity securities registered under section 12(g) of the Securities Exchange Act of 1934; or |
| · | Has, or has had, 300 or more security holders. |
Strategic Realty Holdings, LLC and Strategic Realty Capital, LLC
The prior performance tables reflect properties owned by both Strategic Realty Holdings, LLC (SRH) and Strategic Realty Capital, LLC (SRC).
Our Sponsor, SRH, was formed in 2014 by Edward P. Lorin.
From 2008 to the present, Mr. Lorin has been one of two principals in SRC. In 2015, Mr. Lorin and the other principal of SRC agreed to unwind and begin selling all of the properties owned by SRC, allowing each principal to go his separate way. Over time, all of the assets owned by SRC will be sold. The other principal of SRC is not a principal of SRH, and will not be involved with the Fund.
Strategy and Results
As described at length in “The Fund – Investment Strategy” section starting on page 16, the strategy of our Sponsor is to:
| 1) | Identify C-quality multi-family apartment communities in A- or B-quality locations; |
| 2) | Buy those communities for C-level prices; |
| 3) | Make physical alterations and other improvements to those communities, increasing the quality from C to B or even A; |
| 4) | Improve the quality of life for tenants; |
| 5) | As a result of the alterations and improvements, attract more qualified tenants; and |
| 6) | Increase rents accordingly. |
Page | 42
Of the 39 Projects our sponsor launched using this strategy, 28 Projects – consisting of 40 separate properties – have completed their full investment cycle from acquisition to renovation to rental to sale. As illustrated on the table below, these 28 Projects achieved, on average, an increase of net operating income of 48% per year, annual cash-on-cash returns of 8.55%, and an internal rate of return (IRR) of 24.74%.
|
Hold Period
(Months) |
Units
|
Change in NOI*
(From Purchase Date) |
Average Annual
Cash on Cash Distribution**
|
IRR***
|
|
|
Project Seven
|
23.08
|
216
|
53.64%
|
5.36%
|
46.60%ɸ
|
|
Project Ten
|
28.90
|
436
|
43.83%
|
9.46%
|
15.77%ɸ
|
|
Project Eleven
|
20.27
|
256
|
38.88%
|
10.76%
|
14.90%
|
|
Project Twelve
|
22.60
|
347
|
10.50%
|
4.89%
|
12.36%
|
|
Project Thirteen
|
23.77
|
268
|
33.52%
|
10.49%
|
18.38%
|
|
Project Fourteen
|
48.03
|
1271
|
78.20%
|
3.73%
|
31.01%
|
|
Project Fifteen
|
32.03
|
155
|
294.83%
|
5.54%
|
24.75%
|
|
Project Sixteen
|
38.13
|
200
|
76.29%
|
7.58%
|
29.22%
|
|
Project Seventeen
|
38.10
|
296
|
52.61%
|
1.40%
|
22.62%
|
|
Project Eighteen
|
34.53
|
638
|
41.01%
|
9.14%
|
14.41%
|
|
Project Nineteen
|
38.60
|
346
|
148.74%
|
0.36%
|
30.83%
|
|
Project Twenty
|
37.60
|
282
|
35.98%
|
21.48%
|
61.25%
|
|
Project Twenty One
|
43.13
|
156
|
129.83%
|
22.50%
|
11.63%
|
|
Project Twenty Two
|
37.67
|
400
|
33.77%
|
4.65%
|
24.24%
|
|
Project Twenty Three
|
41.07
|
484
|
76.15%
|
7.00%
|
25.71%
|
|
Project Twenty Four
|
44.57
|
160
|
19.07%
|
7.03%
|
19.91%
|
|
Project Twenty Five
|
43.60
|
195
|
218.10%
|
1.98%
|
13.05%
|
|
Project Twenty Six
|
43.63
|
440
|
32.46%
|
6.15%
|
11.59%
|
|
Project Twenty Seven
|
54.93
|
176
|
405.10%
|
6.09%
|
20.11%
|
|
Project Twenty Eight
|
34.03
|
466
|
96.68%
|
3.98%
|
18.88%
|
|
Project Twenty Nine
|
48.03
|
200
|
14.79%
|
7.39%
|
12.72%
|
|
Project Thirty
|
53.20
|
140
|
92.37%
|
24.47%
|
19.64%
|
|
Project Thirty One
|
52.30
|
536
|
141.74%
|
8.68%
|
37.90%
|
|
Project Thirty Two
|
52.53
|
264
|
93.55%
|
11.02%
|
34.82%
|
|
Project Thirty Three
|
51.67
|
218
|
573.50%
|
7.60%
|
20.28%
|
|
Project Thirty Four
|
57.70
|
330
|
640.03%
|
6.04%
|
25.59%
|
|
Project Thirty Five
|
56.50
|
240
|
81.47%
|
18.47%
|
40.00%
|
|
Project Thirty Six
|
63.17
|
475
|
1097.90%
|
6.24%
|
47.33%
|
|
Average
|
41.55
|
343
|
166.23%
|
8.55%
|
24.74%
|
Page | 43
|
* Net Operating
Income |
We calculate “net operating income” using the industry-standard definition, i.e., the gross income from the property minus operating expenses. The gross income from a property means primarily rental income, but where applicable also includes other income items such as parking fees and income from operating vending machines and laundry facilities. Operating expenses include all of the expenses required to operate the property, such as insurance, property management fees, utilities, property taxes, repairs and janitorial fees. Net operating income does not reflect debt service payments (principal and interest), capital expenditures, or depreciation and amortization.
|
|
** Cash On Cash
Distribution |
We calculate “cash on cash distribution” by dividing the distributions paid by the total equity invested. For example, suppose a property were purchased for $100, using $80 of debt and $20 of equity, and the property paid a distribution of $2 for a given year. The “cash on cash distribution” for that year would be 10%, $2 divided by $20.
|
|
*** IRR
|
“Internal rate of return” is a financial concept that measures the overall return from an investment, taking into account all the money invested and all the money returned, as well as the timing of each contribution and distribution. We calculate the internal rate of return using the XIRR function in Microsoft Excel, the spreadsheet program.
ɸ Projects Seven and Ten each included two properties, one of which has been sold. The IRR for those Projects reflect the property that was sold.
|
CAUTION: PRIOR PERFORMANCE DOES NOT GUARANTY FUTURE RESULTS. THE FACT THAT OUR SPONSOR HAS BEEN SUCCESSFUL WITH THESE PROGRAMS DOES NOT GUARANTY THAT THE FUND WILL BE SUCCESSFUL.
Acquisitions of Properties Within Last Three Years
During the last three years, SRC and SRH have purchased 33 properties. Together, these 33 properties have 6,489 rental units with 5,487,945 rental square feet and cost a total of $381,846,061. For more detailed information, see Table VI of the prior performance tables.
Prior Performance Tables
For more information about the prior Projects, please refer to Appendix A– Results of Prior Projects, below. The information presented in Appendix A is presented as of December 31, 2016.
Page | 44
SECURITIES BEING OFFERED
Description of Securities
We are offering to the public up to $35,000,000 of our Series A Investor Shares, which represent limited liability company interests in the Fund. All of the rights and obligations associated with the Series A Investor Shares are set forth in:
| · |
The LLC Agreement, which is attached as Exhibit 1A-2B; and
|
| · |
The Authorizing Resolution, which is attached as Exhibit 1A-15.2.
|
Price of Series A Investor Shares
Initially, we will offer the Series A Investor Shares at $10 per Series A Investor Share. During the term of this Offering, we may increase or decrease the price per Series A Investor Share to reflect changes in the value of our assets and the amount of our liabilities, which will be determined by the Manager in its sole and absolute discretion.
To determine the price of the Series A Investor Shares, the Manager would:
| · |
Determine the fair market value of the Company’s assets, using appraisals and/or such other methods as the Manager may determine, including its own judgment;
|
| · |
Determine the amount of the Company’s liabilities; and
|
| · |
Determine the amount that a purchaser of Series A Investor Shares would receive if all of the assets of the Company were sold for their fair market values, less hypothetical sales commissions and transaction costs, all the liabilities of the Company were satisfied, and the net proceeds were distributed in accordance with the LLC Agreement.
|
Changes in the price of the Series A Investor Shares will be reflected in a supplement or amendment to this Offering Statement filed with the SEC. At this time, the Manager cannot reasonably estimate when or how often it will amend the Offering price. Such amendments will depend upon numerous factors, including, but not limited to, (i) the amount of capital raised in this Offering, (ii) our ability to effectively deploy the capital we raise, (iii) the timing of actual asset acquisitions and dispositions by the Fund, and (iv) the value of assets acquired or disposed of by the Fund.
Voting Rights
Owners of the Series A Investor Shares – that is, Investors – will have no right to vote or otherwise participate in the management of the Fund. Instead, the Fund is managed by the Manager exclusively. However, without the consent of a majority of the Investors, measured by capital accounts, the Manager may not take any action that would reasonably be expected to have an adverse effect on the Fund.
Page | 45
Distributions
We intend to make distributions periodically, as conditions permit. The order of distributions will be governed by the Fund’s LLC Agreement and by the Authorizing Resolution.
We divide distributions into two categories:
| · | Distributions of ordinary operating cash flow (primarily in the form of rent payments we receive, after expenses); and |
| · | Distributions of the net proceeds from “capital transactions” like sales or refinancing of properties (“net proceeds” means the gross proceeds of the capital transaction, reduced by the expenses of the transaction, including repayment of debt). |
Distributions of ordinary operating cash flow will be in the following order of priority:
| · | Step One: First, Investors will receive all the operating cash flow until they have received a 7% cumulative, non-compounded annual return on their invested capital; and |
| · | Step Two: Second, any remaining operating cash flow will be distributed 65% to the Investors on a pro rata basis, and 35% to the Manager. |
Distributions of the net proceeds from capital transactions will be made in the following order or priority:
| · | Step One: First, Investors will receive all the net proceeds until they have received a 7% cumulative, non-compounded annual return on their invested capital; |
| · | Step Two: Second, Investors will receive any remaining net proceeds to return an allocable portion of the capital they invested* (see explanation below); |
| · | Step Three: Third, any remaining net proceeds will be distributed 65% to the Investors on a pro rata basis and 35% to the Manager until Investors have received a “internal rate of return” of 16%** (see explanation below); and |
| · | Step Four: Fourth, any remaining net proceeds will be distributed 50% to the Investors on a pro rata basis and 50% to the Manager |
We refer to the 7% cumulated, non-compounded annual return of Investors as their “Preferred Return,” and to amounts paid to the Manager as its “Promoted Interest.”
We expect to make distributions of ordinary operating cash flow on a quarterly basis. Distributions of the net proceeds from capital transactions will be made, if at all, upon the occurrence of a capital transaction.
Page | 46
Whether to distribute operating cash flow or capital proceeds, and how much to distribute, are in the sole discretion of the Manager. No returns are guaranteed. Investors will receive distributions only if we are able to generate a profit from the business.
*When we say that all distributions of the net proceeds from capital transactions will first be distributed to Investors until they have received an “allocable portion” of the capital they invested, we mean that when the Fund enters into a capital transaction like a sale or refinancing, and decides to distribute some or all of the proceeds (as opposed to reinvesting the proceeds in other properties), the Manager will allocate all of the capital contributed by Investors (less any previous distributions of capital) among all of the properties owned by the Fund, based on an estimate of the fair market value of each property (less debt encumbering each property). This will allow the Manager to determine how much capital is allocable to the property involved in the capital transaction.
**”Internal rate of return” is a financial concept that measures the overall return from an investment, taking into account all the money you put in as well as all the money you took out, as well as the timing of each contribution and distribution. Solely by way of example, you would have an internal rate of return if you contributed $100 to an investment and:
| · | Liquidated the investment in one year for $116; or |
| · | Received no distributions for five years, and at the end of the fifth year liquidated the investment for $210.03; or |
| · | Received a payment of $16 at the end of year, and received your $100 back at the end of the fifth year. |
We calculate the internal rate of return using the XIRR function in Microsoft Excel, the spreadsheet program.
NOTE CONCERNING CALCULATION OF RETURNS: In general, we will calculate the returns of Investors beginning on the last day of the month in which an Investor purchases his, her, or its Series A Investor Shares. However, we will not begin calculating returns until the date that is three (3) months following the date that the first $3,000,000 raised in the Offering is released from escrow.
EXAMPLE: Suppose that (i) Investor X purchases Series A Investor Shares on February 6, 2017, (ii) Investor Y purchases Series Investor Shares on July 16, 2017, and (iii) the first $3,000,000 raised in the Offering is released from escrow on March 20, 2017. We would begin to calculate the returns of Investor X on June 20, 2017 (the date three months following the release from escrow) and the returns of Investor Y on July 31, 2017 (the last day of the month Investor Y purchased Series A Investor Shares).
The LLC Agreement is attached as Exhibit 1A-2B and the Authorizing Resolution is attached as Exhibit 1A-15.2.
Page | 47
How We Decide How Much To Distribute
To decide how much to distribute, we start with our revenues, which may include rental income and proceeds from the sale or refinancing properties, and then subtract our actual expenses, which may include items such as management fees (including fees to the Manager), bank fees, appraisal costs, insurance, commissions, marketing costs, taxes, legal and accounting fees, travel expenses, and fees paid to third parties. Finally, depending on the circumstances at the time, we decide how much should be held in reserve against future contingencies. The amount we distribute is therefore our revenue, minus our expenses, minus the reserve amount.
Withholding
In some situations, we might be required by law to withhold taxes and/or other amounts from distributions made to Investors. The amount we withhold will still be treated as part of the distribution. For example, if we distribute $100 to you and are required to withhold $10 in taxes, for our purposes you will be treated as having received a distribution of $100 even though only $90 was deposited in your bank account.
No Guaranty
We can only distribute as much money as we have. There is no guaranty that we will have enough money, after paying expenses, to distribute enough to pay a 7% annual return to Investors or even to return all of their invested capital.
Transfers
Investors may freely transfer their Series A Investor Shares, but only after providing the Manager with written assurance that (i) the transfer is not required to be registered under the Securities Act of 1933, (ii) the transferor or the transferee will reimburse the Fund for expenses incurred in connection with the transfer, and (iii) the transfer will not compromise the Fund’s election to be taxed as a REIT for purposes of Federal income taxation.
Mandatory Redemptions
The Manager may require an Investor to sell his, her, or its Series A Investor Shares back to the Company:
| · | If the Investor is an entity governed by the Employee Retirement Income Security Act of 1974, Code section 4975, or any similar Federal, State, or local law, and the Manager determines that all or any portion of the assets of the Fund would, in the absence of the redemption, more likely than not be treated as “plan assets” or otherwise become subject to such laws. |
| · | If the Manager determines that the redemption would be beneficial in allowing the Fund to retain its status as a REIT. |
| · | If the Manager determines that the Investor has engaged in certain misconduct. |
Page | 48
If an Investor’s Series A Investor Shares are purchased pursuant to such a request, the price will be equal to 90% of the amount the selling Investor would have received had all assets of the Fund (including assets held indirectly, through Joint Ventures) been sold for their net asset value and the proceeds, less all liabilities and expenses, been distributed in liquidation of the Fund.
The purchase price will be paid by wire transfer or other immediately-available funds.
Limited Right Of Redemption
At any time after buying Series A Investor Shares, an Investor may ask the Company to purchase, or arrange for the purchase, of all or a portion of the Investor’s Series A Investor Shares. Upon receipt of such a request, the Manager must use commercially reasonable efforts to arrange for the purchase, although there is no guaranty that the necessary funds will be available or that a buyer can be found. If the Manager is not able to purchase or arrange for the purchase of the Series A Investor Shares, the Investor may either rescind or maintain the request.
In seeking to accommodate a request from an Investor, the Manager is not required to do any of the following:
| · | Arrange for the purchase of any Series A Investor Shares within one year after they were issued; |
| · | Arrange for the purchase of more than 25% of an Investor’s Series A Investor Shares during any year. |
| · | Arrange for the purchase of more than 5% of the issued and outstanding Series A Investor Shares during any fiscal year; |
| · | Buy the Series A Investor Shares for its own account; |
| · | Contribute money to buy the Series A Investor Shares; |
| · | Borrow money or dispose of assets; or |
| · | Take any other action the Manager believes would be adverse to the interests of the Fund or its other Members. |
If an Investor’s Series A Investor Shares are purchased pursuant to such a request, the price will be equal to 90% of the amount the selling Investor would have received had all assets of the Fund (including assets held indirectly, through Joint Ventures) been sold for their net asset value and the proceeds, less all liabilities and expenses, been distributed in liquidation of the Fund.
The purchase price will be paid by wire transfer or other immediately-available funds.
If more than one Investor asks the Manager to purchase or arrange for the purchase of Series A Investor Shares, the Manager will consider the requests in the order received.
Page | 49
LIMIT ON AMOUNT NON-ACCREDITED INVESTORS CAN INVEST
As long as you’re at least 18 years old, you can invest in this Offering. But if you’re not an “accredited” investor, the amount you can invest is limited by law.
Under 17 CFR §230.501, a regulation issued by the SEC, the term “accredited investor” means:
| · | A natural person (a human being) who has: |
| o | Individual net worth, or joint net worth with the person’s spouse, that exceeds $1 million at the time of the purchase, excluding the value of the primary residence of such person; OR |
| o | Income exceeding $200,000 in each of the two most recent years, or joint income with a spouse exceeding $300,000 for those years and a reasonable expectation of the same income level in the current year; |
| · | A trust with assets in excess of $5 million, not formed for the specific purpose of acquiring the securities offered, whose purchase is directed by a sophisticated person; |
| · | A business in which all the equity owners are accredited investors; |
| · | An employee benefit plan, within the meaning of the Employee Retirement Income Security Act, if a bank, insurance company, or registered investment adviser makes the investment decisions, or if the plan has total assets in excess of $5 million; |
| · | A bank, insurance company, registered investment company, business development company, or small business investment company; |
| · | A charitable organization, corporation, or partnership, not formed for the specific purpose of acquiring the securities offered, with total assets exceeding $5 million; and |
| · | A director, executive officer, or general partner of the company selling the securities, or any director, executive officer, or general partner of a general partner of that issuer. |
If you fall within any of those categories, then you can invest as much as you want. If you don’t fall within any of those categories, then the most you can invest in this Offering is the greater of:
| · | 10% of your annual income; or |
| · | 10% of your net worth. |
These limits are imposed by law, not by us.
Page | 50
PLAN OF DISTRIBUTION
Size of Offering
We are offering up to $35,000,000 of our Series A Investor Shares in the Offering. We will begin deploying the proceeds of the Offering (that is, we will begin to buy properties) once we have raised at least $3,000,000. If we do not raise at least $3,000,000 on or before December 31, 2018, we will terminate the Offering and return any money we’ve raised to that point, without any deductions.
Term of Offering
The Offering will begin as soon as our offering statement is “qualified” by the SEC. The Offering will end upon the earlier of (1) the date we have sold $35,000,000 of Series A Investor Shares (i.e., all the securities we are offering), (2) the date two years after it begins, or (3) the date we decide to end it.
Minimum Initial Investment
The minimum initial investment is 100 Series A Investor Shares, or $1,000.
Manner of Distribution
Only the Fund itself is selling securities in this Offering. No securities are being sold by or on behalf of any existing owner of the Fund.
Sales Made Through the Fund’s Site
The Series A Investor Shares will be offered by the Fund itself through www.ImpactHousing.com and www.ImpactHousingIRA.com, which we refer to collectively as the “Site.” Purchases and sales of our Series A Investor Shares made through our Site will not be subject to the sales commissions or fees described below.
Sales Made Through Folio
We have also engaged Folio Investments, Inc. (“Folio”), a registered broker-dealer and member FINRA/SIPC, to market and sell our Series A Investor Shares on a non-exclusive, best efforts basis. Folio is not purchasing the Series A Investor Shares and is not required to sell any specific number or dollar amount of Series A Investor Shares. Under the terms of a Securities Distribution Agreement between the Fund and Folio, which is attached as Exhibit 1A-1A, Folio is entitled to receive a sales commission equal to 2.5% of the offering price for each sale of Series A Investor Shares that it makes, payable once the Fund has accepted the purchaser’s subscription and the Offering has closed.
Page | 51
Folio is also entitled to reimbursement of all of its costs, fees and expenses incurred in connection with the performance of its services under the Securities Distribution Agreement, whether or not the Offering is completed; provided, however, that to the extent that such costs, fees or expenses exceed $10,000, any additional costs, fees or expenses that individually exceed $5,000 shall be agreed upon in writing in advance by Folio and the Fund prior to Folio incurring and being reimbursed for such additional costs, fees or expense, and provided further that the total reimbursable costs, fees and expenses reimbursable to Folio shall not exceed $30,000.
Our Securities Distribution Agreement with Folio also provides that, during the term of the Securities Distribution Agreement and for a period of two years thereafter (unless Folio terminates the agreement pursuant to Section 7(c) thereof), the Fund and its affiliates may not contact Investors first introduced to the Fund by Folio for the purpose of selling additional securities of the Fund or its affiliates (“Additional Offerings”) unless Folio is provided a right of first refusal with respect to providing services in connection with such Additional Offerings. Folio may waive this right of first refusal for a cash fee of up to $25,000 (which is subject to reduction to ensure that such amount is not a value in excess of 5% of the underwriting compensation in an Additional Offering); provided that pursuant to FINRA Rule 5110(f)(2)(F)(ii), Folio shall not have more than one opportunity to waive or terminate the right of first refusal in consideration of any payment or fee.
Folio Technology & Closing Services
Folio will provide certain technology, brokerage, custody and closing services in connection with any sales of our securities made through the Folio platform, pursuant to an Escrow Services and Custody Agreement a copy of which is attached as Exhibit 1A-1B. Eligible investors who meet the requirements and abide by the investment limitations described in this Offering Circular may subscribe for Series A Investor Shares through Folio’s platform. We have agreed to pay Folio processing fees equal to 0.7 percent of the gross proceeds from the sale of our Series A Investor Shares by Folio, with a minimum non-refundable fee of $10,000. We have also agreed to pay Folio platform fees in the amount of 0.3 percent of the gross proceeds from the sale of our Series A Investor Shares by Folio and $5,000 for a third party due diligence report that will be provided to Folio prior to the commencement of the Offering.
Eligible investors may subscribe for Series A Investor Shares through Folio by following the account opening instructions on the platform operated by Folio. Eligible investors must transfer the full purchase price of the Series A Investor Shares for which they subscribe to their Folio customer account prior to the closing in which they participate. Funds from subscriptions will be held by Folio in customer accounts for the exclusive benefit of its customers until such time as all conditions to each closing are met and a closing is held, at which time eligible investor funds will be transferred from the eligible investors’ Folio accounts to the account of the issuer at Folio (with actual settlement and issuance of shares to the investor within a few business days of the closing). After the initial closing of this Offering (i.e., once we’ve received and accepted qualifying subscriptions totaling $3,000,000 and the other conditions described below in the “Escrow” section have been satisfied), subsequent closings will be held periodically at our discretion – which could be any time without prior notice. Because subsequent closings will occur periodically at the discretion of the Fund, it is possible that investor funds could be held in their Folio customer accounts for an indeterminate period of time. However, investors will have the right to cancel their subscription and have their funds returned to them at any time prior to the closing. The process described above complies with the requirements of Rule 15c2-4 of the Securities Exchange Act of 1934, as amended, pursuant to a no-action letter dated July 15, 2015 provided to Folio by the SEC.
Page | 52
How To Invest
To Invest Through the Fund’s Site
To buy a Series A Investor Share through the Fund’s Site, go to www.ImpactHousing.com (or, for retirement accounts, www.ImpactHousingIRA.com) and register, locate the Offering, and follow the instructions. We will ask for certain information about you, including:
| · | Your name and address |
| · | Your social security number (for tax reporting purposes) |
| · | Whether you are an “accredited investor” |
| · | If you not an accredited investor, your income and net worth |
We will also ask you to sign our Investment Agreement, a copy of which is attached as Exhibit 1A-6E.
You will pay for your Series A Investor Shares using one of the options described on the Site.
The information you submit, including your signed Investment Agreement, is called your “subscription.” We will review your subscription and decide whether to accept it. We have the right to accept or reject subscriptions in our sole discretion, for any reason or for no reason.
Once we have accepted your subscription, we will notify you by email and the investment process will be complete. We will also notify you by email if we do not accept your subscription, although we might not explain why. We reserve the right to reject any subscription in whole or in part for any reason. If we reject your subscription, we will return all your money without interest or deduction.
Your Series A Investor Shares will be issued in electronic form only. We will not issue you a paper certificate representing your Series A Investor Shares.
To Invest Through Folio
If you decide to subscribe for Series A Investor Shares in this Offering through Folio, you should go to www.folioinvesting.com and click on "Impact Housing REIT" after creating and/or logging into your Folio brokerage account and selecting Private Investments, then follow the procedures as described online.
To invest in this offering through the Folio platform, an eligible investor must have a brokerage account with Folio, either directly or through a broker-dealer that is operating under a fully disclosed clearing agreement with Folio as the clearing brokerage. When submitting the subscription request, an eligible investor is required to agree to various terms and conditions by checking boxes and to review and electronically sign any necessary documents.
Page | 53
Escrow
When you invest through our Site, your money will be held in an escrow account with First Green Bank, a third-party financial institution that will serve as the escrow agent, until:
| · |
We review your subscription and decide whether to accept it; and
|
| · |
We have raised at least $3,000,000.
|
When and if those two conditions are satisfied, we will direct the escrow agent to release your money from the escrow account to the Fund at a time we select (which we intend to do as promptly as practicable following satisfaction of the conditions described above). A copy of the Escrow Agreement with First Green Bank dated effective June 13, 2017, is being filed herewith as Exhibit 1A-8. If these conditions are satisfied and an initial closing is held, subsequent purchases and sales of our Series A Investor Shares through the Site will be done on a rolling basis until the Offering is terminated.
Eligible investor funds from subscriptions through Folio will be held by Folio in customer accounts for the exclusive benefit of its customers until such time as:
| · |
We review your subscription and decide whether to accept it; and
|
| · |
We have raised at least $3,000,000.
|
If and when these conditions are satisfied and an initial closing is held, eligible investor funds will be transferred from the eligible investors’ Folio accounts to the account of the issuer at Folio (see “Folio Technology & Closing Services” above for more information). Subsequent purchases and sales after the initial closing will be made in periodic closings as described in the section titled “Folio Technology & Closing Services”, above. This process complies with the requirements of Rule 15c2-4 of the Exchange Act pursuant to a no-action letter dated July 15, 2015 provided to Folio by the Commission. A copy of the Escrow Services and Custody Agreement with Folio is attached as Exhibit 1A-1B.
If we decide not to accept your subscription or don’t raise at least $3,000,000, we will direct the escrow agent to return your money to you without deduction. Any funds you deposit with Folio will simply remain in your brokerage account with Folio until you withdraw those funds or purchase other securities with them.
Page | 54
Advertising the Offering
After the Offering has been “qualified” by the SEC, we intend to advertise the Offering using the Site and through other means, including public advertisements and audio-visual materials, in each case only as we authorize. Although these materials will not contain information that conflicts with the information in this Offering Circular and will be prepared with a view to presenting a balanced discussion of risk and reward with respect to the Series A Investor Shares, our advertising materials will not give a complete understanding of this Offering, the Fund, or the Series A Investor Shares and are not to be considered part of this Offering Circular. The Offering is made only by means of this Offering Circular and prospective Investors must read and rely on the information provided in this Offering Circular in connection with their decision to invest in the Series A Investor Shares.
Supplements and Amendments to Offering Circular
From time to time we will supplement or amend this Offering Circular during the term of the Offering to reflect changes or additions to the information presented, as required by SEC rules.
Among other things, while the Offering is being conducted (the period described in the “Plan of Distribution – Term of Offering” section starting on page 51) we will file a “sticker supplement” pursuant to Rule 253(g) of SEC Regulation A for each real estate asset we intend to purchase, at such time as we determine that there is a reasonable probability that we will acquire the asset. The supplement will describe the asset and will disclose all compensation and fees paid to the Manager or its affiliates in connection with the acquisition.
At least once every three months, we will consolidate all such sticker supplements into a “post-qualification amendment” to this Offering Circular. Where appropriate, the post-qualification amendment will also include or incorporate by reference audited financial statements meeting the requirements of Rule 3-14 of Regulation S-X for properties acquired during the distribution period.
We will also file, after the end of the distribution period, a current report on Form 1-U containing the financial statements and any additional information required by Rule 3-14 of Regulation S-X (as applicable), to reflect each commitment (i.e., the signing of a binding purchase agreement) to purchase a property made after the end of the distribution period involving the use of 10% or more (on a cumulative basis) of the net proceeds of the Offering, and we will provide the information contained in such report to Investors at least once each quarter after the distribution period ends.
Page | 55
ESTIMATED USE OF PROCEEDS
After payment of the costs we incur in connection with the Offering, including sales commissions and legal, accounting, and marketing costs, we intend to use all of the net proceeds of the Offering to source, acquire, develop (as appropriate) and operate a portfolio comprised primarily of multi-family residential real estate properties.
The table below shows our estimate of how we will use the proceeds of this Offering.
|
Estimated Use of Proceeds
|
||||||||
|
Minimum
|
Maximum
|
|||||||
|
Gross Offering Proceeds
|
$
|
3,000,000
|
$
|
35,000,000
|
||||
|
Sales Commissions & Fees
|
$
|
105,000
|
*
|
$
|
1,225,000
|
*
|
||
|
Offering Expenses
|
$
|
(300,000
|
)
|
$
|
(1,000,000
|
)
|
||
|
Net Proceeds Available for Investment
|
$
|
2,595,000
|
*
|
$
|
32,775,000
|
*
|
||
*For illustrative purposes we have assumed in this table that all sales will be made through Folio. As noted above, the Fund has retained Folio on a non-exclusive basis and the Fund simultaneously intends to sell the Series A Investor Shares through the Fund’s Site, which sales will not be subject to Folio’s commissions and fees.
Page | 56
INVESTMENT COMPANY ACT LIMITATIONS
The Manager intends to conduct our operations so that neither we nor any of our subsidiaries or joint ventures is required to register as an “investment company” under the Investment Company Act of 1940 (as amended, the “Investment Company Act”). If, however, the SEC determined that we were required to register as an investment company, we would be subject to stringent regulation and would be required to undertake costly compliance activities, and we could be subject to fines, penalties and other adverse consequences.
Section 3(a)(1)(A) of the Investment Company Act defines an investment company as any issuer that “is or holds itself out as being engaged primarily, or proposes to engage primarily, in the business of investing, reinvesting, or trading in securities,” and section 3(a)(1)(C) further defines an investment company to include any issuer that “is engaged or proposes to engage in the business of investing, reinvesting, owning, holding, or trading in securities, and owns or proposes to acquire investment securities having a value exceeding 40% of the value of such issuer’s total assets (exclusive of Government securities and cash items) on an unconsolidated basis.”
The business of the Fund is to buy fee simple interests in real estate, which are not “securities” under the Investment Company Act (a “fee simple” interest in real estate means the ownership of the real estate itself). Therefore, we do not believe that we will be required to register as an investment company under section 3(a)(1)(A) of the Investment Company Act.
In addition to buying fee simple interests in real estate, however, the Fund might also invest in “joint ventures” from time to time (see “The Fund – Joint Ventures” section on page 20). In those situations, the Joint Venture will own the fee simple interest in real estate while we will own only an indirect interest in the form of a limited liability company interest or partnership interest.
In some situations, a limited liability company interest or partnership interest could be treated as a “security,” raising a question whether the Fund might be required to register under section 3(a)(1)(C) of the Investment Company Act (if the value of those securities exceeded the 40% threshold). Under our LLC Agreement, however, we may enter into Joint Ventures only where either (i) the Fund will serve as the active manager of the Joint Venture, in which case the interest in the Joint Venture will not be treated as a “security” for purposes of the Investment Company Act, or (ii) the interest in the Joint Venture does not otherwise cause the Fund to be treated as an “investment company” in the opinion of counsel.
Page | 57
SUMMARY OF OUR LLC AGREEMENT AND AUTHORIZING RESOLUTION
The Fund as a whole is governed by an agreement captioned “Limited Liability Company Agreement” dated September 1, 2016. We refer to this as the “LLC Agreement.”
The Series A Investor Shares being offered in this Offering were created when the Manager adopted a resolution pursuant to section 3.1 of the LLC Agreement. We refer to this as the “Authorizing Resolution.”
The following summarizes some of the key provisions of the LLC Agreement and the Authorizing Resolution. This summary is qualified in its entirety by the LLC Agreement itself, which is included as Exhibit 1A-2B, and by the Authorizing Resolution itself, which is included as Exhibit 1A-15.2.
Formation and Ownership
The Fund was formed in Delaware on August 17, 2016 pursuant to the Delaware Limited Liability Company Act.
Under the LLC Agreement, ownership interests in the Fund are referred to as “Shares,” while the owners are referred to as “Members.”
Immediately before this Offering, the only owner of the Fund was the Manager. Investors who buy Series A Investor Shares in the Offering will become owners, and the Fund might admit other owners in the future.
Shares and Ownership
The interests in the Fund are denominated by 20,000,000 “Shares,” consisting of 1,000,000 “Common Shares” and 19,000,000 “Investor Shares.” The Manager may further divide the 19,000,000 Investor Shares into one or more series, by adopting one or more authorizing resolutions. Anyone owning Investor Shares is referred to in the LLC Agreement as an “Investor Member.”
The Manager adopted the Authorizing Resolution to create the Series A Investor Shares. Any Investor who buys Series A Investor Shares in the Offering will be an “Investor Member” under the LLC Agreement.
All of the Common Shares of the Fund are owned by the Manager. The Series A Investor Shares will be owned by Investors, and are the subject of this Offering. By adopting other authorizing resolutions, the Manager may create, offer, and sell other series of Investor Shares in the future, which could have rights superior to the rights of the Series A Investor Shares.
Page | 58
Management
The Manager has complete discretion over all aspects of the business conducted by the Fund. For example, the Manager may (i) admit new members to the Fund; (ii) enter into contracts on behalf of the Fund; (iii) borrow money; (iv) acquire and dispose of assets; (v) determine the timing and amount of distributions to Members; (vi) create new classes of limited liability company interests; (vii) determine the information to be provided to the Members; (viii) grant liens and other encumbrances on the assets of the Fund; (ix) and dissolve the Fund.
Investors who purchase Series A Investor Shares will not have any right to vote on any issue other than certain amendments to the LLC Agreement, or to remove the Manager.
Certain terms of the services to be provided by the Manager, as well as the compensation to be paid to the Manager by the Fund, are set forth in the Management Services Agreement between the Fund and the Manager dated September 1, 2016, which we refer to as the “Management Agreement.” The principal terms of the Management Agreement are summarized in the “Summary of Management Agreement” section starting on page 63, while a copy of the Management Agreement is attached as Exhibit 1A-6A.
The Manager can only be removed for “cause” under a procedure set forth in section 5.6 of the LLC Agreement.
The term “cause” includes:
| · | An uncured breach of the LLC Agreement or the Management Agreement by the Manager; or |
| · | The bankruptcy of the Manager; or |
| · | Certain misconduct on the part of the Manager, if the individual responsible for the misconduct is not terminated. |
A vote to remove the Manager for cause must be approved by Investor Members owning at least two-thirds of the outstanding Investor Shares. Whether “cause” exists would then be decided in arbitration proceedings conducted under the rules of the American Arbitration Association.
Exculpation and Indemnification of Manager
The LLC Agreement protects the Manager and its employees and affiliates from lawsuits brought by Investors. For example, it provides that the Manager will not be responsible to Investors for mistakes, errors in judgment, or other acts or omissions (failures to act) as long as the act or omission was not the result of the Manager’s (i) willful misfeasance, (ii) bad faith, or (iii) gross negligence in the performance of, or reckless disregard of, its duties under the LLC Agreement. This limitation on the liability of the Manager and other parties is referred to as “exculpation.”
Page | 59
The LLC Agreement also requires the Fund to indemnify (reimburse) the Manager, its affiliates, and certain other parties from losses, liabilities, and expenses they incur in performing their duties. For example, if a third party sues the Manager on a matter related to the Fund’s business, the Fund would be required to indemnify the Manager for any losses or expenses it incurs in connection with the lawsuit, including attorneys’ fees. However, this indemnification is not available where a court or other juridical or governmental body determines that the Manager or other person is not entitled to be exculpated under the standard described in the preceding paragraph.
Notwithstanding the foregoing, no exculpation or indemnification is permitted to the extent such exculpation or indemnification would be inconsistent with the requirements of federal or state securities laws or other applicable law.
The detailed rules for exculpation and indemnification are set forth in section 6.2 of the LLC Agreement.
Obligation to Contribute Capital
Once an Investor pays for his, her, or its Series A Investor Shares, he, she, or it will not be required to make any further contributions to the Fund. However, if an Investor has wrongfully received a distribution he, she, or it might have to pay it back.
Personal Liability
No Investor will be personally liable for any of the debts or obligations of the Fund.
Distributions
The manner in which the Fund will distribute its available cash is described in the “Securities Being Offered – Distributions” section beginning on page 45.
Transfers and First Right of Refusal
In general, Investors may freely transfer their Series A Investor Shares. However, the Manager may prohibit a transfer that the Manager determines would jeopardize the status of the Fund as a REIT.
If an Investor wants to sell Series A Investor Shares, the Investor must first offer the Series A Investor Shares to the Manager.
Death, Disability, Etc.
If an Investor who is a human being (as opposed to an Investor that is a legal entity) should die or become incapacitated, the Investor or his, her or its successors will continue to own the Investor’s Series A Investor Shares.
Page | 60
Fees to Manager and Affiliates
The Fund will pay certain management fees and other fees to the Manager, as summarized in the “Compensation of Management” section starting on page 34.
Mandatory Redemption
The Manager may cause the Company to redeem (purchase) the Series A Investor Shares owned by an Investor in any of three circumstances (in effect kicking the Investor out of the deal) as described in the “Securities Being Offering – Mandatory Redemptions” section starting on page 48.
“Drag-Along” Right
If the Manager wants to sell the business conducted by the Fund, it may effect the transaction as a sale of the assets owned by the Fund or as a sale of all the Interests in the Fund. In the latter case, Investors will be required to sell their Series A Investor Shares as directed by the Manager, receiving the same amount they would have received had the transaction been structured as a sale of assets.
Limited Redemption Right
Investors will have a limited right to ask the Company to redeem (buy back) their Series A Investor Shares, as described in the “Securities Being Offered – Limited Right of Redemption” section starting on page 49.
Electronic Delivery
All documents, including all tax-related documents, will be transmitted by the Fund to Investors via electronic delivery.
Amendment
The Manager may amend the LLC Agreement unilaterally (that is, without the consent of anyone else) for a variety of purposes, including to:
| · | Cure ambiguities or inconsistencies in the LLC Agreement; |
| · | Add to its own obligations or responsibilities; |
| · | Change the name of the Fund; |
| · | Ensure that the Fund (including the Fund) satisfies applicable laws, including tax and securities laws; and |
| · | Ensure that the Fund is eligible to be treated as a REIT. |
Page | 61
An amendment that has, or could reasonably be expected to have, an adverse effect on Investors, requires the consent of the Manager and Investors holding a majority of the Series A Investor Shares.
An amendment that would require an Investor to make additional capital contributions or impose personal liability on an Investor requires the consent of the Manager and each affected Investor.
Information Rights
Within 120 days after the end of each fiscal year of the Fund, we will provide Investors with (i) a statement showing in reasonable detail the computation of the distributions made by the Fund, (ii) audited financial statements of the Fund, (iii) a statement of the income and expenses of the Fund, and (iv) a description of the Fund’s investments (including those held through Joint Ventures), and a valuation of the investments performed in good faith by the Manager.
In addition, each year the Fund will provide Investors with a detailed statement showing:
| · | The fees paid to the Manager and its affiliates; and |
| · | Any transactions between the Fund and the Manager or its affiliates. |
In each case, the detailed statement will describe the services performed and the amount of compensation paid.
Within 60 days after the end of the first three fiscal quarters of each fiscal year, we will also provide to Investors a report containing, among other items, an overview of the Fund’s investments and Joint Ventures, unaudited financial statements, a summary of the distributions made during the quarter, and a statement of such Investor’s capital account.
As a “tier 2” issuer under Regulation A, the Fund may also be required to provide investors with additional information on an ongoing basis, including annual audited financial statements, annual reports filed on SEC Form 1-K, semiannual reports filed on SEC Form 1-SA, special financial reports filed on SEC Form 1-K, and current reports on SEC Form 1-U. If, however, our Series A Investor Shares are held “of record” by fewer than 300 persons, these reporting obligations could be terminated.
A Member’s right to see additional information or inspect the books and records of the Fund is limited by the LLC Agreement.
Page | 62
SUMMARY OF MANAGEMENT AGREEMENT
Impact Housing REIT Manager, LLC is designated as the “manager” of the Fund under the LLC Agreement. Under section 5.2 of the LLC Agreement, the Manager has:
[F]ull and complete authority, power and discretion to manage and control the business, affairs and properties of the Company, to make all decisions regarding those matters, to execute any contracts or other instruments on behalf of the Company, and to perform any and all other acts or activities customary or incidental to the management of the Company’s business.
The Company and the Manager entered into a contract called a “Management Services Agreement” dated September 1, 2016, which we refer to as the “Management Agreement.” The Management Agreement describes at length and in detail many of the duties of the Manager, and also describes the Manager’s compensation. However, the list of the Manager’s duties and authority in the Management Agreement is not exclusive. Under the broad grant of authority in the LLC Agreement, the Manager could have duties and authority not listed in the Management Agreement.
The Management Agreement is included as Exhibit 1A-6A.
The duties of the Manager include managing our investments, raising money, accounting and administrative services, and managing investor relations. Some of the specific duties of the Manager are:
| · | Conducting this Offering |
| · | Establishing investment guidelines, policies, and procedures |
| · | Overseeing and conducting due diligence |
| · | Arranging for financing from banks and other financial institutions |
| · | Reviewing joint venture opportunities |
| · | Keeping and maintaining the books and records of the Fund |
| · | Managing the Fund’s portfolio of assets |
| · | Managing the administrative and back-office functions of the Fund |
| · | Collecting, maintaining, and distributing information |
| · | Determining the improvements to be made to properties owned by the Fund |
| · | Maintaining appropriate technology systems |
Page | 63
| · | Making, changing, and revoking tax elections including making an election be treated as a REIT and to be treated as a corporation for tax purposes |
| · | Complying with SEC requirements |
| · | Managing distributions and payments to Investors; |
| · | Handling redemption requests from Investors |
| · | Engaging property managers, contractors, attorneys, accountants, and other third parties |
| · | Entering into contracts and other agreement |
The compensation of the Manager is described in the “Compensation of Management” section starting on page 34.
The Management Agreement will remain in effect for as long as the Manager is the manager of the Fund under the LLC Agreement.
Page | 64
ALLOCATION OF EXPENSES AND INVESTMENT OPPORTUNITIES
The Fund has no direct employees. The Manager will use and rely upon the executive management team and real estate professionals of our Sponsor and its affiliates.
The following discusses the policies and procedure we intend to follow with respect to three important items:
| 1) | Which entity pays for which expenses |
| 2) | How we allocate investment opportunities as between the Fund on one hand and our Sponsor and its other affiliates on the other hand |
| 3) | Our plans to create other funds |
Payment of Expenses
The Manager will be responsible for compensating its employees and contractors, including salaries, wages, payroll taxes, and the cost of benefit plans. The Manager will also be responsible for rent, telephone, utilities, office furniture, equipment, machinery and other office, internal and overhead expenses of the Manager required for the Fund’s day-to-day operations, including, bookkeeping, clerical and back-office services provided by the Manager.
The Fund will pay all of the other costs of operating its business, including:
| · | Costs and expenses associated with the formation of the Fund and the Manager |
| · | The costs of this Offering |
| · | The cost of buying, operating, and selling real estate assets, appraisal fees, insurance premiums, commitment fees, brokerage fees, guaranty fees, ad valorem taxes, costs of foreclosure, property management, maintenance, and the cost of repair and improvement |
| · | Financing costs |
| · | Taxes |
| · | Insurance premiums |
| · | Custodian, transfer agent, and registrar fees |
| · | Legal and accounting fees |
| · | Travel and related expenses of the Manager incurred in connection with the business of the Fund |
Page | 65
| · | Costs incurred to comply with the reporting and other requirements of governmental bodies or agencies, including the cost of preparing and distributing reports to Investors |
| · | Technology costs |
Allocation of Investment Opportunities
Mr. Lorin, the principal owner of the Manager and our Sponsor, has been investing in multi-family apartment communities for approximately 15 years. He is likely to become aware of many opportunities in the multi-family market while the Fund is operating. To minimize the risk of conflict, Mr. Lorin has agreed that if he becomes aware of a multi-family apartment community that satisfies the criteria established for the Fund by the Manager and the Fund has the resources to buy such community, then the Fund will be given the opportunity to buy that community, before the Sponsor, the Manager, or any other entity controlled by Mr. Lorin. The only exceptions are:
| · | Communities that are already owned by the Sponsor or an affiliate |
| · | Communities within the immediate vicinity of any of those communities |
Other Funds
Mr. Lorin has also agreed not to create a fund with the same investment objectives as the Fund until the earlier of:
| · | The date that is two years following the qualification of the Offering by the SEC; or |
| · | The date that the Fund has raised $35,000,000 in the Offering. |
For these purposes, a fund will be deemed to have the same investment objectives as the Fund if:
| · | The fund purchases fee simple interests in underperforming multi-family apartment communities, requiring “value add” additions and renovations; and |
| · | The fund is offered pursuant to Regulation A or in an offering registered under the Securities Act; and |
| · | Investors in the fund acquire equity, not debt. |
These restrictions do not apply to funds involving “affordable housing” as defined by Federal, State, or local law.
Page | 66
Allocation of Certain Low-Income Housing Opportunities
The principals of our Sponsor are parties to a joint venture program pursuant to which they have agreed to present certain low-income housing investment opportunities that they become aware of to the joint venture, and to give the joint venture the right to acquire such opportunities, before allocating such opportunities to the Sponsor’s other investment programs, including the Fund.
These restrictions apply to apartment complexes that:
| · |
Are encumbered by some form of land use restriction agreement or other regulatory agreement restricting occupancy of at least 10% of all residential dwelling units to affordable housing or other low-income targeted tenant base; or
|
| · |
Have qualified for a low-income housing tax credit transaction pursuant to section 42 of the Code, with the 10-year tax credit period associated therewith expired and the 15-year compliance period associated therewith either expired or near expiration.
|
Thus, the Fund does not intend to invest in apartment complexes in either of those categories.
Page | 67
FEDERAL INCOME TAX CONSEQUENCES
The following summarizes some of the Federal income tax consequences of the Fund and Investors. This summary is based on the Internal Revenue Code (the “Code”), regulations issued by the Internal Revenue Service (“Regulations”), and administrative rulings and court decisions, all as they exist today. The tax laws, and therefore the Federal income tax consequences of acquiring Series A Investor Shares, could change in the future.
This is only a summary, applicable to a generic Investor. Your personal situation could differ. We encourage you to consult with your own tax advisor before investing.
Federal Income Taxation of the Fund
We intend to elect to be taxed as a “real estate investment trust,” or “REIT,” beginning with our first taxable year.
Assuming that we qualify as a REIT, the Fund itself will generally not be subject to federal income taxes on net income that is currently distributed to shareholders. The Fund will, however, be subject to federal income tax as follows:
| · | We will be taxed at regular corporate tax rates on any undistributed REIT taxable income, including undistributed net capital gains. |
| · | A REIT may generally be subject to the “alternative minimum tax.” |
| · | If we have (i) net income from the sale or other disposition of “foreclosure property” which is held primarily for sale to customers in the ordinary course of business or (ii) other non-qualifying income from foreclosure property, we will be subject to tax at the highest corporate rate on such income. |
| · | If the Fund has net income from “prohibited transactions” (which are, in general, certain sales or other dispositions of property held primarily for sale to customers in the ordinary course of business other than foreclosure property), such income will be subject to a tax of 100% of the net income from such prohibited transactions. |
| · | If we are able to maintain our qualification as a REIT despite any failure to satisfy either the 75% or 95% income test (discussed below), we will be subject to a 100% tax on an amount equal to (a) the gross income attributable to the greater of the amount by which the Fund fails the 75% or 95% of income test multiplied by (b) a specified fraction. |
| · | If we maintain our qualification as a REIT, despite any failure to satisfy the REIT asset tests (discussed below), then we will have to pay a tax equal to the greater of $50,000 or the highest marginal corporate tax rate multiplied by the net income generated by the qualifying assets. |
Page | 68
| · | A REIT will be subject to a 4.0% excise tax if it fails to make certain minimum distributions each calendar year. |
| · | A 35% tax will be imposed on the excess inclusions allocable to disqualified entities that hold interests in the REIT. |
| · | If a REIT acquires any asset from a C corporation (i.e., generally a corporation subject to full corporate-level tax) in a carryover basis transaction (or if a REIT such as the Fund holds assets beginning on the first day of the first taxable year for which the Fund qualifies as a REIT) and the REIT subsequently recognizes gain on the disposition of such asset during the 10-year period (the Recognition Period) beginning on the date on which the asset was acquired by the REIT (or the REIT first qualified as a REIT), then the excess of: (a) the fair market value of the assets as of the beginning of the applicable Recognition Period, over (b) the REIT’s adjusted basis in such assets as of the beginning of such Recognition Period will be subject to tax at the highest regular corporate rate, pursuant to guidelines issued by the Service (the Built-In Gain Rules). |
| · | A REIT will be subject to a tax equal to 100% of re-determined rents, re-determined deductions, and excess interest between a REIT and its taxable REIT subsidiary. |
| · | A REIT will be subject to the personal holding company tax, if the REIT qualifies as a personal holding company and has undistributed personal holding company income. |
If we failed to satisfy one or more of the technical requirements described below, we might nevertheless be entitled to be treated as a REIT under certain “relief” provisions. Otherwise, we would be subject to tax on our taxable income at regular corporate rates, with no deduction allowed for distributions to shareholders. The resulting corporate income tax liability would significantly reduce the cash available for distribution to Investors.
Requirements for Qualifying as a REIT
To qualify as a REIT, we must elect to be treated as a REIT and meet certain requirements related to our organization, income, assets and distributions. Each set of requirements is discussed in turn below.
Organizational Requirements
The Code defines a REIT as a corporation, trust or association:
| · | Managed by one or more trustees or directors; |
| · | The beneficial ownership of which is evidenced by transferable shares, or by transferable certificates of beneficial ownership; |
Page | 69
| · | Which (but for sections 856 through 859 of the Code) would be taxable as a domestic corporation; |
| · | Which is neither a financial institution nor an insurance company within the meaning of the applicable provisions of the Code; |
| · | The beneficial ownership of which is held by at least 100 persons; |
| · | During the last half of each taxable year, is not closely held, i.e., not more than 50% of the value of its outstanding stock is owned, directly or indirectly, by or for five or fewer “individuals,” as defined in the Code to include certain entities; |
| · | Files an election or continues such election to be taxed as a REIT on its return for each taxable year; |
| · | Uses the calendar year as its taxable year; and |
| · | Meets other tests described below, including with respect to the nature of its assets and income and the amount of its distributions. |
Income Test Requirements
To maintain qualification as a REIT, on an annual basis we must meet the following two gross income requirements:
| · | At least 75% of our gross income for the taxable year must be derived from, among other things, rents from real property (with some exceptions), interest on obligations secured by mortgages, and certain gains on the sales of property. |
| · | In addition to deriving 75% of our gross income from, among other things, the sources listed above, at least 95% of the REIT’s gross income for the taxable year must be derived from the above-described qualifying income, or from dividends, interest or gains from the sale or disposition of stock or other securities that are not dealer property. |
To satisfy the gross income requirements any “rents from real property” received must meet the following conditions:
| · | The amount of rent must not be based in whole or in part on the income or profits of any person, but can be based on a fixed percentage of receipts or sales; |
| · | The rent cannot be from a tenant of which we and our affiliates own 10% or more of (i) the total combined voting power of all classes of voting stock, or total value of shares of all classes of stock, if a corporate tenant, or (ii) the interests in the assets or net profits of an entity, if not a corporate tenant; |
Page | 70
| · | The rent cannot be attributable to personal property unless it is leased in connection with real property and the rent attributable to such personal property is less than or equal to 15% of the total rent received for the taxable year attributable to both the real and personal property leased under such lease; and |
| · | The rent cannot be attributable to services furnished or rendered in connection with the rental of real property, unless such services are customarily provided in connection with the rental of real property, whether or not such charges are separately stated. |
We do not anticipate deriving rent attributable to personal property leased in connection with real property that exceeds 15% of the total rent attributable to such lease.
We may provide certain services with respect to our properties. We believe that these services will only be of the type that are usually or customarily rendered in connection with the rental of space for occupancy and that are not otherwise rendered to the tenants. Therefore, we believe that the provision of such customary services will not cause rents received with respect to our properties to fail to qualify as “rents from real property.” Non-customary services and services rendered primarily for the tenants’ convenience will be provided by an independent contractor or a taxable REIT subsidiary to avoid jeopardizing the qualification of rent as “rents from real property.”
Except for amounts received with respect to certain investments of cash reserves, we anticipate that substantially all of our gross income will be derived from sources that will allow us to satisfy the income tests described above; however, we can make no assurance in this regard.
Asset Test Requirements
At the close of each quarter of the taxable year, we must also satisfy the following four tests related to the nature and diversification of our assets:
| · | At least 75% of the value of our total assets must be represented by real estate assets, cash and cash items (including receivables) and government securities; |
| · | No more than 25% of the value of our total assets can be represented by securities (other than those securities includible in the 75% asset test); |
| · | No more than 20% of the value of our total assets can be represented by securities of one or more taxable REIT subsidiaries; and |
| · | With the exception of taxable REIT subsidiaries and those securities includible under the 75% asset test, we may not own: |
| o | Securities of any one issuer whose value exceeds 5% of the value of our total assets; |
| o | More than 10% of any one issuer’s outstanding voting securities; and |
Page | 71
| o | More than 10% of the value of the outstanding securities of any one issuer. |
Annual Distribution Requirements
To qualify as a REIT, we must meet the following annual distribution requirements:
| · | We must distribute (other than capital gain distributions) to our beneficiaries an amount at least equal to the sum of: (i) 90% of the REIT taxable income (computed without regard to the dividends-paid deduction and by excluding our net capital gain), and (ii) 90% of the net income, if any, from foreclosure property in excess of the excise tax on net income from foreclosure property, minus the sum of certain items of non-cash income. |
| · | We must distribute during each calendar year at least the combined sum of 85% of our ordinary income for that year; 95% of our capital gain net income for that year; and any undistributed taxable income from prior periods. |
| · | We may not dispose of any asset that is subject to the Built-In Gain Rules during the 10-year period beginning on the date on which we acquired the asset. |
We expect that our REIT taxable income will be less than our cash flow due to the allowance of depreciation and other non-cash charges in computing REIT taxable income. Accordingly, we anticipate that we generally will have sufficient cash or liquid assets to enable us to satisfy the 90% distribution requirement. It is possible, however, that we may not have sufficient cash or other liquid assets to meet the 90% distribution requirement or to distribute such greater amount as may be necessary to avoid income and excise tax. In such event, we may find it necessary to borrow funds to pay the required distribution or, if possible, pay taxable stock dividends in order to meet the distribution requirement.
Taxation Of Investors
How Income is Reported To Investors
Each Investor will receive a Form 1099 from the Fund each year, and will transfer the information onto his, her, or its personal tax return. Investors will not receive a Form K-1 from the Fund.
Taxation of Distributions
Distributions to Investors other than “capital gain dividends” will be treated as taxable dividends up to the amount of the Fund’s current or accumulated earnings and profits. To the extent that we make a distribution in excess of our positive current or accumulated earnings and profits, the distribution will be treated first as a tax-free return of capital, up to an Investor’s tax “basis” in his, her, or its Series A Investor Shares, then as capital gain.
Page | 72
Dividends that we declare in October, November, or December of any year payable to stockholders of record on a specified date in any such month are treated as both paid by us and received by Investors on December 31 of that year, provided that we actually pay the dividends during January of the following calendar year.
Dividends from the Fund will not be treated as “qualifying dividends,” which are eligible for lower tax rates (generally the same tax rates that apply to long term capital gains).
“Capital gain dividends” will be reported as long-term capital gains on the tax returns of Investors (to the extent that they do not exceed our actual net capital gain for the taxable year), without regard to how long an Investor has owned his, her, or its Series A Investor Shares.
Taxation of Losses
Because the Fund will be taxed as a corporation, and not as a partnership, Investors may not report on their own income tax returns any tax losses incurred by the Fund.
Additional Medicare Tax
Higher-income taxpayers are subject to an additional 3.8% tax on net “investment income.” Income Investors receive from the Fund will be included as “investment income” for these purposes.
Tax on Sale of Series A Investor Shares
An Investor who sells Series A Investor Shares generally will realize capital gain or loss equal to the difference between the selling price and his, her, or its adjusted tax “basis” in the Series A Investor Shares. If the Investor has owned the Series A Investor Shares for at least one year, any gain would generally be treated as long term capital gain.
Passive Activity Losses
Taxable distributions from the Fund will not be treated as “passive activity income” under Code section 469 and may not be offset against losses from passive activities.
Withholding Taxes
We might be required to withhold federal income tax from distributions under certain circumstances, e.g., where an Investor has failed to provide us with a valid taxpayer identification number.
Page | 73
LEGAL PROCEEDINGS
Neither the Fund itself, the Manager, or any of their respective employees, officers, directors, managers, or members is currently engaged in any material legal proceedings, other than ordinary routine litigation incidental to the business of owning and leasing residential real estate.
Neither the Fund itself, the Manager, or any of their respective employees, officers, directors, managers, or members is, to the knowledge of the Fund, current the subject of any investigation or proceedings by any governmental authorities.
Page | 74
CERTAIN RELATIONSHIPS AND RELATED TRANSACTIONS
The Fund has entered into a Management Agreement with the Manager, pursuant to which the Manager will provide management and investment management services as described in the “Management” section starting on page 59. Under the Management Agreement, the Fund will pay the Manager certain fees as described in the “Compensation of Management” section starting on page 34. The Manager is an affiliate of our Sponsor, Strategic Realty Holdings, LLC, and will rely on its management team and real estate professionals for the operation of our business. Thus, the amount of fees and other terms of the Management Agreement were determined among related parties and not at arm’s-length.
Page | 75
TESTING THE WATERS MATERIALS
Before the Offering is qualified by the SEC, we might engage in what is commonly referred to as “testing the waters” under 17 CFR §230.255. For example, we might ask for expressions of interest via the Site.
In accordance with the SEC’s rules, all of our communications with potential investors will:
| · |
State that no money or other consideration is being solicited, and if sent in response, will not be accepted;
|
| · |
State that no offer to buy the securities can be accepted and no part of the purchase price can be received until the offering statement is qualified, and any such offer may be withdrawn or revoked, without obligation or commitment of any kind, at any time before notice of its acceptance given after the qualification date;
|
| · |
State that a person’s indication of interest involves no obligation or commitment of any kind; and
|
| · |
Either:
|
| o |
State from whom a copy of the most recent version of the Preliminary Offering Circular may be obtained, including a phone number and address of such person;
|
| o |
Provide the URL where such Preliminary Offering Circular, or the offering statement in which such Preliminary Offering Circular was filed, may be obtained; or
|
| o |
Include a complete copy of the Preliminary Offering Circular.
|
A copy of any such communications will be filed with the SEC.
Page | 76
Impact Housing REIT, LLC
Delaware Limited Liability Company
Financial Statements and Independent Auditor’s Report
December 31, 2017
Page | 77
IMPACT HOUSING REIT, LLC
TABLE OF CONTENTS
|
Page
|
|
|
INDEPENDENT AUDITOR’S REPORT
|
F-1-2
|
|
FINANCIAL STATEMENTS AS OF DECEMBER 31, 2017 AND FOR THE YEAR THEN
ENDED: |
|
|
Balance Sheet
|
F-3
|
|
Statement of Operations
|
F-4
|
|
Statement of Changes in Member’s Equity (Deficit)
|
F-5
|
|
Statement of Cash Flows
|
F-6
|
|
Notes to Financial Statements
|
F-7–10
|
Page | 78
To the Member of
Impact Housing REIT, LLC
Calabasas, CA
INDEPENDENT AUDITOR’S REPORT
Report on the Financial Statements
We have audited the accompanying financial statements of Impact Housing REIT, LLC, which comprise the balance sheet as of December 31, 2017, and the related statements of operations, changes in member’s equity (deficit), and cash flows for the year then ended, and the related notes to the financial statements.
Management’s Responsibility for the Financial Statements
Management is responsible for the preparation and fair presentation of these financial statements in accordance with accounting principles generally accepted in the United States of America; this includes the design, implementation, and maintenance of internal control relevant to the preparation and fair presentation of financial statements that are free from material misstatement, whether due to fraud or error.
Auditor’s Responsibility
Our responsibility is to express an opinion on these financial statements based on our audit. We conducted our audit in accordance with auditing standards generally accepted in the United States of America. Those standards require that we plan and perform the audit to obtain reasonable assurance about whether the financial statements are free from material misstatements.
An audit involves performing procedures to obtain audit evidence about the amounts and disclosures in the financial statements. The procedures selected depend on the auditor’s judgment, including the assessment of the risks of material misstatement of the financial statements, whether due to fraud or error. In making those risk assessments, the auditor considers internal control relevant to the entity’s preparation and fair presentation of the financial statements in order to design audit procedures that are appropriate in the circumstances, but not for the purpose of expressing an opinion on the effectiveness of the entity’s internal control. Accordingly, we express no such opinion. An audit also includes evaluating the appropriateness of accounting policies used and the reasonableness of significant accounting estimates made by management, as well as evaluating the overall presentation of the financial statements. We believe that the audit evidence we have obtained is sufficient and appropriate to provide a basis for our audit opinion.
Artesian CPA, LLC
1624 Market Street, Suite 202 | Denver, CO 80202
p: 877.968.3330 f: 720.634.0905
info@ArtesianCPA.com | www.ArtesianCPA.com
F-1
Opinion
In our opinion, the financial statements referred to above present fairly, in all material respects, the financial position of Impact Housing REIT, LLC as of December 31, 2017, and the results of its operations and its cash flows for the year then ended, in accordance with accounting principles generally accepted in the United States of America.
Emphasis of Matter Regarding Going Concern
The accompanying financial statements have been prepared assuming that the Company will continue as a going concern. As described in Note 3 to the financial statements, the Company has not yet commenced planned principal operations and has not generated revenues or profits since inception. These factors, among others, raise substantial doubt about the Company’s ability to continue as a going concern. Management’s plans in regard to these matters are also described in Note 3. The financial statements do not include any adjustments that might result from the outcome of this uncertainty. Our opinion is not modified with respect to this matter.

Denver, Colorado
April 24, 2018
Artesian CPA, LLC
1624 Market Street, Suite 202 | Denver, CO 80202
p: 877.968.3330 f: 720.634.0905
info@ArtesianCPA.com | www.ArtesianCPA.com
F-2
IMPACT HOUSING REIT, LLC
BALANCE SHEET
As of December 31, 2017
|
ASSETS
|
||||
|
Current Assets:
|
||||
|
Offering costs
|
$
|
195,657
|
||
|
Prepaid insurance
|
16,014
|
|||
|
Total Current Assets
|
211,671
|
|||
|
TOTAL ASSETS
|
$
|
211,671
|
||
|
LIABILITIES AND MEMBER'S EQUITY (DEFICIT)
|
||||
|
Liabilities:
|
||||
|
Current Liabilities:
|
||||
|
Advances from related party
|
$
|
439,766
|
||
|
Accrued expenses
|
4,449
|
|||
|
Total Liabilities
|
444,215
|
|||
|
Total Member's Equity (Deficit)
|
(232,544
|
)
|
||
|
TOTAL LIABILITIES AND MEMBER'S EQUITY (DEFICIT)
|
$
|
211,671
|
||
See Independent Auditor’s Report and accompanying notes, which are an integral part of these financial statements.
F-3
IMPACT HOUSING REIT, LLC
STATEMENT OF OPERATIONS
For the year ended December 31, 2017
|
Net revenues
|
$
|
-
|
||
|
Costs of net revenues
|
-
|
|||
|
Gross profit
|
-
|
|||
|
Operating Expenses:
|
||||
|
Advertising & marketing
|
172,582
|
|||
|
Professional fees
|
24,703
|
|||
|
Travel expenses
|
14,701
|
|||
|
Meals & entertainment
|
7,406
|
|||
|
Dues & subscriptions
|
3,623
|
|||
|
Insurance expense
|
498
|
|||
|
Telephone
|
334
|
|||
|
Total Operating Expenses
|
223,847
|
|||
|
Net Loss
|
$
|
(223,847
|
)
|
See Independent Auditor’s Report and accompanying notes, which are an integral part of these financial statements.
F-4
IMPACT HOUSING REIT, LLC
STATEMENT OF CHANGES IN MEMBER’S EQUITY (DEFICIT)
For the year ended December 31, 2017
|
Total Member's
Equity (Deficit) |
||||
|
Balance at December 31, 2016
|
$
|
(8,697
|
)
|
|
|
Net loss
|
(223,847
|
)
|
||
|
Balance at December 31, 2017
|
$
|
(232,544
|
)
|
|
See Independent Auditor’s Report and accompanying notes, which are an integral part of these financial statements.
F-5
IMPACT HOUSING REIT, LLC
STATEMENT OF CASH FLOWS
For the year ended December 31, 2017
|
Cash Flows From Operating Activities
|
||||
|
Net Loss
|
$
|
(223,847
|
)
|
|
|
Adjustments to reconcile net loss to net cash
used in operating activities: |
||||
|
Changes in operating assets and liabilities:
|
||||
|
(Increase)/Decrease in deferred offering costs
|
(22,404
|
)
|
||
|
(Increase)/Decrease in prepaid insurance
|
(16,014
|
)
|
||
|
(Increase)/Decrease in refunds receivable
|
20,000
|
|||
|
Increase/(Decrease) in accrued expenses
|
(21,559
|
)
|
||
|
Net Cash Used In Operating Activities
|
(263,824
|
)
|
||
|
Cash Flows From Financing Activities
|
||||
|
Advances from related party
|
263,824
|
|||
|
Net Cash Provided By Financing Activities
|
263,824
|
|||
|
Net Change In Cash
|
-
|
|||
|
Cash at Beginning of Period
|
-
|
|||
|
Cash at End of Period
|
$
|
-
|
||
|
Supplemental Disclosure of Cash Flow Information
|
||||
|
Cash paid for interest
|
$
|
-
|
||
|
Cash paid for income taxes
|
$
|
-
|
||
See accompanying Independent Auditor’s Report and accompanying notes, which are an integral part of these financial statements.
F-6
IMPACT HOUSING REIT, LLC
NOTES TO FINANCIAL STATEMENTS
As of December 31, 2017 and for the year then ended
NOTE 1: NATURE OF OPERATIONS
Impact Housing REIT, LLC (the “Company”), is a limited liability company organized August 17, 2016 under the laws of Delaware. The Company was organized to source and acquire residential apartment communities and to renovate, lease, operate, and maintain such properties.
As of December 31, 2017, the Company has not commenced planned principal operations nor generated revenue. The Company’s activities since inception have consisted of formation activities and preparations to raise capital. Once the Company commences its planned principal operations, it will incur significant additional expenses. The Company is dependent upon additional capital resources for the commencement of its planned principal operations and is subject to significant risks and uncertainties; including failing to secure funding to operationalize the Company’s planned operations or failing to profitably operate the business.
NOTE 2: SUMMARY OF SIGNIFICANT ACCOUNTING POLICIES
Basis of Presentation
The accounting and reporting policies of the Company conform to accounting principles generally accepted in the United States of America (GAAP).
The Company adopted the calendar year as its basis of reporting.
Use of Estimates
The preparation of financial statements in conformity with accounting principles generally accepted in the United States (“GAAP”) requires management to make estimates and assumptions that affect the reported amounts of assets and liabilities and disclosures of contingent assets and liabilities at the date of the financial statements and the reported amounts of revenues and expenses during the reporting period. Actual results could differ from those estimates.
Cash Equivalents and Concentration of Cash Balance
The Company considers all highly liquid securities with an original maturity of less than three months to be cash equivalents. The Company’s cash and cash equivalents in bank deposit accounts, at times, may exceed federally insured limits.
Deferred Offering Costs
The Company complies with the requirements of FASB ASC 340-10-S99-1 with regards to offering costs. Prior to the completion of an offering, offering costs are capitalized. The deferred offering costs are charged to stockholders’ equity upon the completion of an offering or to expense if the offering is not completed.
F-7
IMPACT HOUSING REIT, LLC
NOTES TO FINANCIAL STATEMENTS
As of December 31, 2017 and for the year then ended
Fair Value of Financial Instruments
Financial Accounting Standards Board (“FASB”) guidance specifies a hierarchy of valuation techniques based on whether the inputs to those valuation techniques are observable or unobservable. Observable inputs reflect market data obtained from independent sources, while unobservable inputs reflect market assumptions. The hierarchy gives the highest priority to unadjusted quoted prices in active markets for identical assets or liabilities (Level 1 measurement) and the lowest priority to unobservable inputs (Level 3 measurement). The three levels of the fair value hierarchy are as follows:
Level 1 - Unadjusted quoted prices in active markets for identical assets or liabilities that the reporting entity has the ability to access at the measurement date. Level 1 primarily consists of financial instruments whose value is based on quoted market prices such as exchange-traded instruments and listed equities.
Level 2 - Inputs other than quoted prices included within Level 1 that are observable for the asset or liability, either directly or indirectly (e.g., quoted prices of similar assets or liabilities in active markets, or quoted prices for identical or similar assets or liabilities in markets that are not active).
Level 3 - Unobservable inputs for the asset or liability. Financial instruments are considered Level 3 when their fair values are determined using pricing models, discounted cash flows or similar techniques and at least one significant model assumption or input is unobservable.
The carrying amounts reported in the balance sheets approximate their fair value.
Revenue Recognition
The Company recognizes revenue when: (1) persuasive evidence exists of an arrangement with the customer reflecting the terms and conditions under which products or services will be provided; (2) delivery has occurred or services have been provided; (3) the fee is fixed or determinable; and (4) collection is reasonably assured. No revenue has been earned or recognized as of December 31, 2017.
Organizational Costs
In accordance with Financial Accounting Standards Board (FASB) Accounting Standards Codification (ASC) 720, organizational costs, including accounting fees, legal fees, and costs of incorporation, are expensed as incurred. Certain expenses were incurred prior to the Company’s inception and are recognized in these financial statements as being incurred effective on the inception date.
Income Taxes
The Company is a limited liability company. Accordingly, under the Internal Revenue Code, all taxable income or loss flows through to its members. Therefore, no provision for income tax has been recorded in the statements. Income from the Company is reported and taxed to the members on their individual tax returns.
F-8
IMPACT HOUSING REIT, LLC
NOTES TO FINANCIAL STATEMENTS
As of December 31, 2017 and for the year then ended
The Company complies with FASB ASC 740 for accounting for uncertainty in income taxes recognized in a company’s financial statements, which prescribes a recognition threshold and measurement process for financial statement recognition and measurement of a tax position taken or expected to be taken in a tax return. For those benefits to be recognized, a tax position must be more-likely-than-not to be sustained upon examination by taxing authorities. FASB ASC 740 also provides guidance on derecognition, classification, interest and penalties, accounting in interim periods, disclosure and transition. Based on the Company’s evaluation, it has been concluded that there are no significant uncertain tax positions requiring recognition in the Company’s financial statements. The Company believes that its income tax positions would be sustained on audit and does not anticipate any adjustments that would result in a material change to its financial position.
The Company may in the future become subject to federal, state and local income taxation though it has not been since its inception. The Company is not presently subject to any income tax audit in any taxing jurisdiction.
Net Earnings or Loss per Unit
Net earnings or loss per unit is computed by dividing net income or loss by the weighted-average number of units outstanding during the period, excluding units subject to redemption or forfeiture. The Company presents basic and diluted net earnings or loss per unit. Diluted net earnings or loss per unit reflect the actual weighted average of units issued and outstanding during the period, adjusted for potentially dilutive securities outstanding. Potentially dilutive items are excluded from the computation of the diluted net earnings or loss per unit if their inclusion would be anti-dilutive. As no potentially dilutive items exist and no membership units are outstanding as of December 31, 2017, the Company has not presented basic net loss per unit or diluted net loss per unit.
NOTE 3: GOING CONCERN
The accompanying financial statements have been prepared on a going concern basis, which contemplates the realization of assets and the satisfaction of liabilities in the normal course of business. The Company is a business that has not commenced planned principal operations, plans to incur significant costs in pursuit of its capital financing plans, and has not generated any revenues since inception. The Company’s ability to continue as a going concern in the next twelve months is dependent upon its ability to obtain capital financing from investors sufficient to meet current and future obligations and deploy such capital to produce profitable operating results. No assurance can be given that the Company will be successful in these efforts. These factors, among others, raise substantial doubt about the ability of the Company to continue as a going concern for a reasonable period of time. The financial statements do not include any adjustments relating to the recoverability and classification of recorded asset amounts or the amounts and classification of liabilities that might be necessary should the Company be unable to continue as a going concern.
NOTE 4: MEMBER’S EQUITY
In September 2016, the Company issued 1,000,000 Common Shares to its Manager (see Note 5). No capital has been contributed to the Company as of December 31, 2017. The Company is 100% owned by its manager as of December 31, 2017 and is authorized to issue additional membership units consisting of 1,000,000 Common Shares and 19,000,000 Investor Shares.
F-9
IMPACT HOUSING REIT, LLC
NOTES TO FINANCIAL STATEMENTS
As of December 31, 2017 and for the year then ended
There are differing rights and privileges between the two share classes, as defined in the Company’s LLC Agreement.
The debts, obligations, and liabilities of the Company, whether arising in contract, tort, or otherwise, are solely the debts, obligations, and liabilities of the Company, and no member of the Company is obligated personally for any such debt, obligation, or liability.
NOTE 5: RELATED PARTY TRANSACTIONS
The Company has named Impact Housing REIT Manager, LLC (the “Manager”) as manager of the Company, under a management agreement, and is the sole member of the Company as of December 31, 2017. The Company is subject to various fees under this agreement, as dictated by the management agreement.
The Company utilizes office space and office services provided at no cost from a related party. Such costs are immaterial to the financial statements and, accordingly, have not been reflected in these financial statements.
The Company has a balance due to the Manager in the sum of $439,766 which is payable on demand and bears no interest.
NOTE 6: RECENT ACCOUNTING PRONOUNCEMENTS
Management does not believe that any recently issued, but not yet effective, accounting standards could have a material effect on the accompanying financial statements. As new accounting pronouncements are issued, the Company will adopt those that are applicable under the circumstances.
NOTE 7: SUBSEQUENT EVENTS
Management has evaluated subsequent events through April 24, 2018, the date the financial statements were available to be issued. Based on this evaluation, no material events were identified which require adjustment or disclosure in these financial statements.
F-10
Impact Housing REIT, LLC
Delaware Limited Liability Company
Financial Statements and Independent Auditor’s Report
December 31, 2016
Page | 79
IMPACT HOUSING REIT, LLC
TABLE OF CONTENTS
|
Page
|
|
|
INDEPENDENT AUDITOR’S REPORT
|
F-1-2
|
|
FINANCIAL STATEMENTS AS OF DECEMBER 31, 2016 AND FOR THE PERIOD
|
|
|
FROM AUGUST 17, 2016 (INCEPTION) TO DECEMBER 31, 2016:
|
|
|
Balance Sheet
|
F-3
|
|
Statement of Operations
|
F-4
|
|
Statement of Changes in Member’s Equity
|
F-5
|
|
Statement of Cash Flows
|
F-6
|
|
Notes to Financial Statements
|
F-7–11
|
Page | 80
To the Member of
Impact Housing REIT, LLC
Calabasas, CA
INDEPENDENT AUDITOR’S REPORT
Report on the Financial Statements
We have audited the accompanying financial statements of Impact Housing REIT, LLC, which comprise the balance sheet as of December 31, 2016, and the related statements of operations, changes in member’s equity, and cash flows for the period from August 17, 2016 (inception) to December 31, 2016, and the related notes to the financial statements.
Management’s Responsibility for the Financial Statements
Management is responsible for the preparation and fair presentation of these financial statements in accordance with accounting principles generally accepted in the United States of America; this includes the design, implementation, and maintenance of internal control relevant to the preparation and fair presentation of financial statements that are free from material misstatement, whether due to fraud or error.
Auditor’s Responsibility
Our responsibility is to express an opinion on these financial statements based on our audit. We conducted our audit in accordance with auditing standards generally accepted in the United States of America. Those standards require that we plan and perform the audit to obtain reasonable assurance about whether the financial statements are free from material misstatements.
An audit involves performing procedures to obtain audit evidence about the amounts and disclosures in the financial statements. The procedures selected depend on the auditor’s judgment, including the assessment of the risks of material misstatement of the financial statements, whether due to fraud or error. In making those risk assessments, the auditor considers internal control relevant to the entity’s preparation and fair presentation of the financial statements in order to design audit procedures that are appropriate in the circumstances, but not for the purpose of expressing an opinion on the effectiveness of the entity’s internal control. Accordingly, we express no such opinion. An audit also includes evaluating the appropriateness of accounting policies used and the reasonableness of significant accounting estimates made by management, as well as evaluating the overall presentation of the financial statements. We believe that the audit evidence we have obtained is sufficient and appropriate to provide a basis for our audit opinion.
Artesian CPA, LLC
1624 Market Street, Suite 202 | Denver, CO 80202
p: 877.968.3330 f: 720.634.0905
info@ArtesianCPA.com | www.ArtesianCPA.com
Page | F-1
Opinion
In our opinion, the financial statements referred to above present fairly, in all material respects, the financial position of Impact Housing REIT, LLC as of December 31, 2016, and the results of its operations and its cash flows for the period from August 17, 2016 (inception) to December 31, 2016, in accordance with accounting principles generally accepted in the United States of America.
Emphasis of Matter Regarding Going Concern
The accompanying financial statements have been prepared assuming that the Company will continue as a going concern. As described in Note 3 to the financial statements, the Company has not yet commenced planned principal operations and has not generated revenues or profits since inception. These factors, among others, raise substantial doubt about the Company’s ability to continue as a going concern. Management’s plans in regard to these matters are also described in Note 3. The financial statements do not include any adjustments that might result from the outcome of this uncertainty. Our opinion is not modified with respect to this matter.
/s/ Artesian CPA, LLC
Denver, Colorado
June 28, 2017
Artesian CPA, LLC
1624 Market Street, Suite 202 | Denver, CO 80202
p: 877.968.3330 f: 720.634.0905
info@ArtesianCPA.com | www.ArtesianCPA.com
Page | F-2
IMPACT HOUSING REIT, LLC
BALANCE SHEET
As of December 31, 2016
|
ASSETS
|
||||
|
Current Assets:
|
||||
|
Offering costs
|
$
|
173,253
|
||
|
Refund receivable
|
20,000
|
|||
|
Total Current Assets
|
193,253
|
|||
|
TOTAL ASSETS
|
$
|
193,253
|
||
|
LIABILITIES AND MEMBER'S EQUITY
|
||||
|
Liabilities:
|
||||
|
Current Liabilities:
|
||||
|
Advances from related party
|
$
|
175,942
|
||
|
Accrued expenses
|
26,008
|
|||
|
Total Liabilities
|
201,950
|
|||
|
Total Member's Equity
|
(8,697
|
)
|
||
|
TOTAL LIABILITIES AND MEMBER'S EQUITY
|
$
|
193,253
|
||
See Independent Auditor’s Report and accompanying notes, which are an integral part of these financial statements.
Page | F-3
IMPACT HOUSING REIT, LLC
STATEMENT OF OPERATIONS
For the period from August 17, 2016 (inception) to December 31, 2016
|
Net revenues
|
$
|
-
|
||
|
Cost of net revenues
|
-
|
|||
|
Gross Profit
|
-
|
|||
|
Operating Expenses:
|
||||
|
Professional fees
|
4,436
|
|||
|
Travel expenses
|
2,347
|
|||
|
Dues & subscriptions
|
1,550
|
|||
|
Meals and entertainment
|
364
|
|||
|
Total Operating Expenses
|
8,697
|
|||
|
Net Loss
|
$
|
(8,697
|
)
|
|
|
Weighted-average units outstanding
|
||||
|
-Basic and Diluted
|
N/A
|
|||
|
Net loss per unit
|
||||
|
-Basic and Diluted
|
N/A
|
See Independent Auditor’s Report and accompanying notes, which are an integral part of these financial statements.
Page | F-4
IMPACT HOUSING REIT, LLC
STATEMENT OF CHANGES IN MEMBER’S EQUITY
For the period from August 17, 2016 (inception) to December 31, 2016
|
Total Member's
Equity
|
||||
|
Balance at August 17, 2016 (inception)
|
$
|
-
|
||
|
Capital contributions
|
-
|
|||
|
Distributions
|
-
|
|||
|
Net loss
|
(8,697
|
)
|
||
|
Balance at December 31, 2016
|
$
|
(8,697
|
)
|
|
See Independent Auditor’s Report and accompanying notes, which are an integral part of these financial statements.
Page | F-5
IMPACT HOUSING REIT, LLC
STATEMENT OF CASH FLOWS
For the period from August 17, 2016 (inception) to December 31, 2016
|
Cash Flows From Operating Activities
|
||||
|
Net Loss
|
$
|
(8,697
|
)
|
|
|
Adjustments to reconcile net loss to net cash used
in operating activities: |
||||
|
Changes in operating assets and liabilities:
|
||||
|
Increase/(Decrease) in deferred offering costs
|
(173,253
|
)
|
||
|
Increase/(Decrease) in refunds receivable
|
(20,000
|
)
|
||
|
Increase/(Decrease) in accrued expenses
|
26,008
|
|||
|
Net Cash Used in Operating Activities
|
(175,942
|
)
|
||
|
Cash Flows from Financing Activities
|
||||
|
Advances from related party
|
175,942
|
|||
|
Net Cash Provided by Financing Activities
|
175,942
|
|||
|
Net Change In Cash
|
-
|
|||
|
Cash at Beginning of Period
|
-
|
|||
|
Cash at End of Period
|
$
|
-
|
||
See accompanying Independent Auditor’s Report and accompanying notes, which are an integral part of these financial statements.
Page | F-6
IMPACT HOUSING REIT, LLC
NOTES TO FINANCIAL STATEMENTS
As of December 31, 2016 and for the period from August 17, 2016 (inception) to December 31, 2016
NOTE 1: NATURE OF OPERATIONS
Impact Housing REIT, LLC (the “Company”), is a limited liability company organized August 17, 2016 under the laws of Delaware. The Company was organized to source and acquire residential apartment communities and to renovate, lease, operate, and maintain such properties.
As of December 31,2016, the Company has not commenced planned principal operations nor generated revenue. The Company’s activities since inception have consisted of formation activities and preparations to raise capital. Once the Company commences its planned principal operations, it will incur significant additional expenses. The Company is dependent upon additional capital resources for the commencement of its planned principal operations and is subject to significant risks and uncertainties; including failing to secure funding to operationalize the Company’s planned operations or failing to profitably operate the business.
NOTE 2: SUMMARY OF SIGNIFICANT ACCOUNTING POLICIES
Basis of Presentation
The accounting and reporting policies of the Company conform to accounting principles generally accepted in the United States of America (GAAP).
The Company has adopted Accounting Standards Update No. 2014-10, Development Stage Entities (Topic 915): Elimination of Certain Financial Reporting Requirements; the Company does not present or disclose inception-to-date information and other remaining disclosure requirements of Topic 915.
The Company adopted the calendar year as its basis of reporting.
Use of Estimates
The preparation of financial statements in conformity with accounting principles generally accepted in the United States (“GAAP”) requires management to make estimates and assumptions that affect the reported amounts of assets and liabilities and disclosures of contingent assets and liabilities at the date of the financial statements and the reported amounts of revenues and expenses during the reporting period. Actual results could differ from those estimates.
Cash equivalents and Concentration of Cash Balance
The Company considers all highly liquid securities with an original maturity of less than three months to be cash equivalents. The Company’s cash and cash equivalents in bank deposit accounts, at times, may exceed federally insured limits.
Deferred Offering Costs
The Company complies with the requirements of FASB ASC 340-10-S99-1 with regards to offering costs. Prior to the completion of an offering, offering costs are capitalized. The deferred offering costs are charged to stockholders’ equity upon the completion of an offering or to expense if the offering is not completed.
See accompanying Independent Auditor’s Report
Page | F-7
IMPACT HOUSING REIT, LLC
NOTES TO FINANCIAL STATEMENTS
As of December 31, 2016 and for the period from August 17, 2016 (inception) to December 31, 2016
Refund Receivable
The Company is due a refund from overpayment on the offering costs in the amount of $20,000. This amount was due as of December 31, 2016. This will be refunded in 2017.
Fair Value of Financial Instruments
Financial Accounting Standards Board (“FASB”) guidance specifies a hierarchy of valuation techniques based on whether the inputs to those valuation techniques are observable or unobservable. Observable inputs reflect market data obtained from independent sources, while unobservable inputs reflect market assumptions. The hierarchy gives the highest priority to unadjusted quoted prices in active markets for identical assets or liabilities (Level 1 measurement) and the lowest priority to unobservable inputs (Level 3 measurement). The three levels of the fair value hierarchy are as follows:
Level 1 - Unadjusted quoted prices in active markets for identical assets or liabilities that the reporting entity has the ability to access at the measurement date. Level 1 primarily consists of financial instruments whose value is based on quoted market prices such as exchange-traded instruments and listed equities.
Level 2 - Inputs other than quoted prices included within Level 1 that are observable for the asset or liability, either directly or indirectly (e.g., quoted prices of similar assets or liabilities in active markets, or quoted prices for identical or similar assets or liabilities in markets that are not active).
Level 3 - Unobservable inputs for the asset or liability. Financial instruments are considered Level 3 when their fair values are determined using pricing models, discounted cash flows or similar techniques and at least one significant model assumption or input is unobservable.
The carrying amounts reported in the balance sheets approximate their fair value.
Revenue Recognition
The Company recognizes revenue when: (1) persuasive evidence exists of an arrangement with the customer reflecting the terms and conditions under which products or services will be provided; (2) delivery has occurred or services have been provided; (3) the fee is fixed or determinable; and (4) collection is reasonably assured. No revenue has been earned or recognized as of December 31, 2016.
Organizational Costs
In accordance with Financial Accounting Standards Board (FASB) Accounting Standards Codification (ASC) 720, organizational costs, including accounting fees, legal fees, and costs of incorporation, are expensed as incurred. Certain expenses were incurred prior to the Company’s inception and are recognized in these financial statements as being incurred effective on the inception date.
Income Taxes
The Company is a limited liability company. Accordingly, under the Internal Revenue Code, all taxable income or loss flows through to its members. Therefore, no provision for income tax has been recorded in the statements. Income from the Company is reported and taxed to the members on their individual tax returns.
See accompanying Independent Auditor’s Report
Page | F-8
IMPACT HOUSING REIT, LLC
NOTES TO FINANCIAL STATEMENTS
As of December 31, 2016 and for the period from August 17, 2016 (inception) to December 31, 2016
The Company complies with FASB ASC 740 for accounting for uncertainty in income taxes recognized in a company’s financial statements, which prescribes a recognition threshold and measurement process for financial statement recognition and measurement of a tax position taken or expected to be taken in a tax return. For those benefits to be recognized, a tax position must be more-likely-than-not to be sustained upon examination by taxing authorities. FASB ASC 740 also provides guidance on derecognition, classification, interest and penalties, accounting in interim periods, disclosure and transition. Based on the Company’s evaluation, it has been concluded that there are no significant uncertain tax positions requiring recognition in the Company’s financial statements. The Company believes that its income tax positions would be sustained on audit and does not anticipate any adjustments that would result in a material change to its financial position.
The Company may in the future become subject to federal, state and local income taxation though it has not been since its inception. The Company is not presently subject to any income tax audit in any taxing jurisdiction.
Net Earnings or Loss per Unit
Net earnings or loss per unit is computed by dividing net income or loss by the weighted-average number of units outstanding during the period, excluding units subject to redemption or forfeiture. The Company presents basic and diluted net earnings or loss per unit. Diluted net earnings or loss per unit reflect the actual weighted average of units issued and outstanding during the period, adjusted for potentially dilutive securities outstanding. Potentially dilutive items are excluded from the computation of the diluted net earnings or loss per unit if their inclusion would be anti-dilutive. As no potentially dilutive items exist and no membership units are outstanding as of December 31, 2016, the Company has not presented basic net loss per unit or diluted net loss per unit.
NOTE 3: GOING CONCERN
The accompanying financial statements have been prepared on a going concern basis, which contemplates the realization of assets and the satisfaction of liabilities in the normal course of business. The Company is a business that has not commenced planned principal operations, plans to incur significant costs in pursuit of its capital financing plans, and has not generated any revenues since inception. The Company’s ability to continue as a going concern in the next twelve months is dependent upon its ability to obtain capital financing from investors sufficient to meet current and future obligations and deploy such capital to produce profitable operating results. No assurance can be given that the Company will be successful in these efforts. These factors, among others, raise substantial doubt about the ability of the Company to continue as a going concern for a reasonable period of time. The financial statements do not include any adjustments relating to the recoverability and classification of recorded asset amounts or the amounts and classification of liabilities that might be necessary should the Company be unable to continue as a going concern.
See accompanying Independent Auditor’s Report
Page | F-9
IMPACT HOUSING REIT, LLC
NOTES TO FINANCIAL STATEMENTS
As of December 31, 2016 and for the period from August 17, 2016 (inception) to December 31, 2016
NOTE 4: MEMBER’S EQUITY
In September 2016, the Company issued 1,000,000 Common Shares to its Manager (see Note 5). No capital has been contributed to the Company as of December 31, 2016. The common shares were issued to the Manager in connection with the formation of the Company to reflect that the Manager was at that time the sole equity owner of the Company. The Company is 100% owned by its manager as of December 31, 2016 and is authorized to issue additional membership units consisting of 1,000,000 Common Shares and 19,000,000 Investor Shares. Given the absence of quoted prices in active markets and the lack of previous sales of the Company’s shares, the Company determined that the fair value of the stock is zero and therefore no capital was paid in as the fair value of the membership units issued was zero. In making this determination, the Company considered that there had been no transactions or activity prior to or immediately subsequent to the initial stock sale other than the start-up expenses incurred.
See accompanying Independent Auditor’s Report
Page | F-10
IMPACT HOUSING REIT, LLC
NOTES TO FINANCIAL STATEMENTS
As of December 31, 2016 and for the period from August 17, 2016 (inception) to December 31, 2016
There are differing rights and privileges between the two share classes, as defined in the Company’s LLC Agreement.
The debts, obligations, and liabilities of the Company, whether arising in contract, tort, or otherwise, are solely the debts, obligations, and liabilities of the Company, and no member of the Company is obligated personally for any such debt, obligation, or liability.
NOTE 5: RELATED PARTY TRANSACTIONS
The Company has named Impact Housing REIT Manager, LLC (the “Manager”) as manager of the Company, under a management agreement, and is the sole member of the Company as of December 31, 2016. The Company is subject to various fees under this agreement, as dictated by the management agreement.
The Company utilizes office space and office services provided at no cost from a related party. Such costs are immaterial to the financial statements and, accordingly, have not been reflected in these financial statements.
The Company has a balance due to Impact Housing REIT Manager, LLC (the “Manager”) in the sum of $175,942 which is payable on demand and bears no interest.
NOTE 6: RECENT ACCOUNTING PRONOUNCEMENTS
Management does not believe that any recently issued, but not yet effective, accounting standards could have a material effect on the accompanying financial statements. As new accounting pronouncements are issued, the Company will adopt those that are applicable under the circumstances.
NOTE 7: SUBSEQUENT EVENTS
The Company has commenced efforts towards a securities offering under Regulation A for up to $35,000,000. Preparations for this offering have not yet been finalized, nor has the offering been qualified by the Securities and Exchange Commission.
Management has evaluated subsequent events through June 28, 2017, the date the financial statements were available to be issued. Based on this evaluation, no additional material events were identified which require adjustment or disclosure in these financial statements.
See accompanying Independent Auditor’s Report
Page | F-11
APPENDIX A
RESULTS OF PRIOR PROJECTS
Introduction
The Sponsor of the Fund is Strategic Realty Holdings, LLC (which we refer to as “SRH”), and the principal owner and manager of the Sponsor is Eddie Lorin.
From 2008 to the present, as the sole principal of SRH and one of two principals of Strategic Realty Capital, LLC, which we refer to as “SRC,” Mr. Lorin has purchased another 72 underperforming communities in transactions valued at over $1 billion. Mr. Lorin has managed or purchased apartment communities in California, Nevada, Arizona, Washington, Colorado, Texas, Louisiana, Mississippi, Alabama, Georgia, Tennessee, Florida, North Carolina, South Carolina, Virginia, Illinois, and Maryland.
The 72 communities purchased by Mr. Lorin and his team involved approximately 39 different offerings of securities, raising approximately $260 million from approximately 50 outside investors. We refer to each of these securities offerings and the properties they included as a “Project.”
All of these Projects are similar to the Fund in the following respects:
| · |
They all involve raising money from investors.
|
| · |
They all involve conducting the same business as the business in which the Fund will be engaged, i.e., investing in underperforming multi-family apartment communities.
|
| · |
Each of the Projects also has investment objectives that are identical to the investment objectives of the Fund.
|
Prior Performance Tables
We are providing five tables that illustrate the results of the Projects:
|
Table
|
Projects Included in Table
|
Purpose and Subject Matter
|
|
I. Experience Raising Funds
|
· Projects the offering of which closed within the last three years.
|
Provides information concerning the offerings themselves, including how the offering proceeds were deployed.
|
Page | 81
|
II. Compensation to Sponsor
|
· Projects the offering of which closed within the last three years.
· Other Projects from which the Sponsor received compensation during the last three years.
|
Describes all compensation paid to the sponsor within the last three years, whether in the form of management fees or otherwise.
|
|
III. Operating Results
|
· Projects the offering of which closed within the last five years.
|
Sets forth the annual operating results of the Projects included.
|
|
IV. Completed Projects
|
· Projects completed (no longer own properties) within the last five years.
|
Summarizes the results of the Projects included, including the return to Project investors.
|
|
V. Sales of Property
|
· All Projects that have sold property within the last three years.
|
Summarizes the result of property sales.
|
|
VI. Purchases of Property
|
· Purchases of property within the last three years.
|
Summarizes each property purchase, including number of units, purchase price, and financing.
|
Because of the similarities between the Projects and the Fund, investors who are considering purchasing Series A Investor Shares from the Fund might find it useful to review these tables. However, prospective investors should bear in mind that PRIOR PERFORMANCE DOES NOT GUARANTY FUTURE RESULTS. THE FACT THAT OUR SPONSOR HAS BEEN SUCCESSFUL WITH THESE PROJECTS DOES NOT GUARANTY THAT THE FUND WILL BE SUCCESSFUL.
Strategic Realty Holdings, LLC and Strategic Realty Capital, LLC
The prior performance tables reflect properties owned by both Strategic Realty Holdings, LLC (SRH) and Strategic Realty Capital, LLC (SRC).
Our Sponsor, SRH, was formed in 2014 by Eddie Lorin.
From 2008 to the present, Mr. Lorin has been one of two principals in SRC. In 2015, Mr. Lorin and the other principal of SRC began the process of dissolving SRC so that each principal could go his separate way. Over time, the assets owned by SRC will be sold.
The other principal of SRC is not a principal of SRH, and will not be involved with the Fund.
Page | 82
Appraisal of Certain Assets
SRC acquired 26 apartment communities with a single investor. In 2015 SRC divided those properties with the investor as follows:
| · |
The investor took 20 of the properties;
|
| · |
SRC took five of the properties; and
|
| · |
One of the properties was sold.
|
To achieve an equitable split, the parties (each represented by counsel) had each of the 26 properties appraised.
For purposes of the prior performance tables, we are treating the properties retained by the investor as having been sold on the date of the split for their appraised value.
Caution Concerning Accuracy
Because we no longer have access to information concerning the 20 properties taken by the investor referred to above, there could be some inaccuracies. Even if there are inaccuracies, however, we believe they are not material to any individual prior performance table or to the prior performance tables as a whole and that investors may rely on the information as presented.
Page | 83
|
Table I. Experience Raising Funds
|
||||
|
Offerings Closed Within the Last Three Years
|
||||
|
Page 1
|
||||
|
Project One
|
Project Two
|
Project Three
|
Project Four
|
|
|
Date Offering Closed
|
11/22/2016
|
10/29/2015
|
8/27/2015
|
1/14/2015
|
|
Duration of Offering in Months
|
6.80
|
3.60
|
2.83
|
4.73
|
|
Months to Invest 90% of Amount Raised
|
6.80
|
3.60
|
2.83
|
4.73
|
|
Amount Offered (and Raised)
|
7,034,404
|
3,780,000
|
9,839,559
|
1,540,312
|
|
Less Organizational and Offering Expenses
|
-
|
-
|
-
|
-
|
|
Less Reserves
|
-
|
-
|
-
|
-
|
|
Amount Available for Investment
|
7,034,404
|
3,780,000
|
9,839,559
|
1,540,312
|
|
Purchase Price of Real Estate
|
12,100,000
|
11,600,000
|
34,150,000
|
4,102,008
|
|
Cost of Renovations and Improvements
|
2,081,840
|
-
|
2,181,031
|
1,000,000
|
|
Percent Leverage
|
51.46%
|
70.39%
|
76.70%
|
57.82%
|
Page | 84
|
Table I. Experience Raising Funds
|
||||
|
Offerings Closed Within the Last Three Years
|
||||
|
Page 2
|
||||
|
Project Five
|
Project Six
|
Project Seven
|
Project Eight
|
|
|
Date Offering Closed
|
12/31/2014
|
11/25/2014
|
10/29/2014
|
10/14/2014
|
|
Duration of Offering in Months
|
1.33
|
11.63
|
10.73
|
2.57
|
|
Months to Invest 90% of Amount Raised
|
1.33
|
11.63
|
10.73
|
2.57
|
|
Amount Offered (and Raised)
|
1,705,037
|
2,650,000
|
9,280,000
|
5,560,000
|
|
Less Organizational and Offering Expenses
|
-
|
-
|
-
|
-
|
|
Less Reserves
|
-
|
-
|
-
|
-
|
|
Amount Available for Investment
|
1,705,037
|
2,650,000
|
9,280,000
|
5,560,000
|
|
Purchase Price of Real Estate
|
5,800,000
|
12,950,000
|
29,600,000
|
13,000,000
|
|
Cost of Renovations and Improvements
|
845,000
|
1,138,000
|
2,325,000
|
1,092,000
|
|
Percent Leverage
|
75.24%
|
75.95%
|
69.54%
|
64.93%
|
Page | 85
|
Table I. Experience Raising Funds
|
||||
|
Offerings Closed Within the Last Three Years
|
||||
|
Page 3
|
||||
|
Project Nine
|
Project Ten
|
Project Eleven
|
Project Twelve
|
|
|
Date Offering Closed
|
9/19/2014
|
12/23/2013
|
8/30/2013
|
6/21/2013
|
|
Duration of Offering in Months
|
9.87
|
4.07
|
1.60
|
4.03
|
|
Months to Invest 90% of Amount Raised
|
9.87
|
4.07
|
1.60
|
4.03
|
|
Amount Offered (and Raised)
|
45,442,490
|
7,236,947
|
4,539,748
|
9,612,208
|
|
Less Organizational and Offering Expenses
|
-
|
-
|
-
|
-
|
|
Less Reserves
|
-
|
-
|
-
|
-
|
|
Amount Available for Investment
|
45,442,490
|
7,236,947
|
4,539,748
|
9,612,208
|
|
Purchase Price of Real Estate
|
193,114,636
|
17,250,000
|
10,700,000
|
26,100,000
|
|
Cost of Renovations and Improvements
|
18,288,059
|
2,200,000
|
1,465,000
|
2,258,000
|
|
Percent Leverage
|
72.87%
|
68.73%
|
65.68%
|
70.30%
|
Page | 86
|
Table II. Compensation to Sponsor During Last Three Years
|
|||||
|
Page 1
|
|||||
|
Project One
|
Project Two
|
Project Three
|
Project Four
|
||
|
Date Offering Closed
|
11/22/2016
|
10/29/2015
|
8/27/2015
|
1/14/2015
|
|
|
Amount Raised
|
7,034,404
|
3,780,000
|
9,839,559
|
1,540,312
|
|
|
Fees from Offering Proceeds
|
|
|
|
|
|
|
Acquisition Fees
|
193,125
|
166,875
|
478,617
|
100,000
|
|
|
Other
|
-
|
-
|
-
|
-
|
|
|
Fees from Operations
|
|
|
|
|
|
|
Property Management Fees
|
-
|
34,176
|
104,539
|
49,266
|
|
|
Partnership Management Fees
|
-
|
-
|
-
|
-
|
|
|
Distributions of "Promoted Interest"
|
-
|
-
|
-
|
-
|
|
|
Other
|
-
|
-
|
-
|
-
|
|
|
Fees from Sales and Refinancings
|
|
|
|
|
|
|
Commissions
|
-
|
-
|
-
|
-
|
|
|
Disposition Fees
|
-
|
-
|
-
|
-
|
|
|
Distributions of "Promoted Interest"
|
-
|
-
|
-
|
-
|
|
|
Other
|
-
|
-
|
-
|
-
|
|
Page | 87
|
Table II. Compensation to Sponsor During Last Three Years
|
|||||
|
Page 2
|
|||||
|
Project Five
|
Project Six
|
Project Seven
|
Project Eight
|
||
|
Date Offering Closed
|
12/31/2014
|
11/25/2014
|
10/29/2014
|
10/14/2014
|
|
|
Amount Raised
|
1,705,037
|
2,650,000
|
9,280,000
|
5,560,000
|
|
|
Fees from Offering Proceeds
|
|
|
|
|
|
|
Acquisition Fees
|
87,500
|
147,500
|
148,000
|
184,447
|
|
|
Other
|
-
|
-
|
-
|
-
|
|
|
Fees from Operations
|
|
|
|
|
|
|
Property Management Fees
|
68,777
|
66,741
|
61,317
|
76,941
|
|
|
Partnership Management Fees
|
-
|
-
|
-
|
-
|
|
|
Distributions of "Promoted Interest"
|
-
|
-
|
-
|
-
|
|
|
Other
|
-
|
-
|
-
|
-
|
|
|
Fees from Sales and Refinancings
|
|
|
|
|
|
|
Commissions
|
-
|
-
|
-
|
-
|
|
|
Disposition Fees
|
-
|
-
|
-
|
-
|
|
|
Distributions of "Promoted Interest"
|
-
|
-
|
-
|
-
|
|
|
Other
|
-
|
-
|
-
|
-
|
|
Page | 88
|
Table II. Compensation to Sponsor During Last Three Years
|
|||||
|
Page 3
|
|||||
|
Project Nine
|
Project Ten
|
Project Eleven
|
Project Twelve
|
||
|
Date Offering Closed
|
9/19/2014
|
12/23/2013
|
8/30/2013
|
6/21/2013
|
|
|
Amount Raised
|
45,442,490
|
7,236,947
|
4,539,748
|
9,612,208
|
|
|
Fees from Offering Proceeds
|
|
|
|
|
|
|
Acquisition Fees
|
1,206,966
|
360,000
|
366,400
|
513,000
|
|
|
Other
|
-
|
-
|
-
|
-
|
|
|
Fees from Operations
|
|
|
|
|
|
|
Property Management Fees
|
373,765
|
130,347
|
29,993
|
101,942
|
|
|
Partnership Management Fees
|
-
|
-
|
-
|
-
|
|
|
Distributions of "Promoted Interest"
|
-
|
-
|
-
|
-
|
|
|
Other
|
-
|
-
|
-
|
-
|
|
|
Fees from Sales and Refinancings
|
|
|
|
|
|
|
Commissions
|
-
|
-
|
-
|
-
|
|
|
Disposition Fees
|
-
|
-
|
-
|
-
|
|
|
Distributions of "Promoted Interest"
|
-
|
-
|
-
|
-
|
|
|
Other
|
-
|
-
|
-
|
-
|
|
Page | 89
|
Table II. Compensation to Sponsor During Last Three Years
|
|||||
|
Page 4
|
|||||
|
Other Projects*
|
|||||
|
Date Offering Closed
|
2012 - 2013
|
||||
|
Amount Raised
|
48,241,997
|
||||
|
Fees from Offering Proceeds
|
|
||||
|
Acquisition Fees
|
1,534,343
|
||||
|
Other
|
-
|
||||
|
Fees from Operations
|
|
||||
|
Property Management Fees
|
852,770
|
||||
|
Partnership Management Fees
|
-
|
||||
|
Distributions of "Promoted Interest"
|
-
|
||||
|
Other
|
-
|
||||
|
Fees from Sales and Refinancings
|
|
||||
|
Commissions
|
-
|
||||
|
Disposition Fees
|
-
|
||||
|
Distributions of "Promoted Interest"
|
1,620,365
|
||||
|
Other
|
-
|
||||
|
*Reflects 7 Projects Closed More Than Three Years Ago, But Less Than Five
|
|||||
Page | 90
|
Table III. Operating Results
|
||||||||||
|
Key Vista
|
||||||||||
|
Project 1
|
||||||||||
|
Year Ended
|
||||||||||
|
Dec 31 2016
|
||||||||||
|
Summary Operating Results
|
||||||||||
|
|
Gross revenues
|
$ 206,547.72
|
||||||||
|
Operating expenses
|
$ (175,660.06)
|
|||||||||
|
|
Opearing income (loss)
|
$ 30,887.66
|
||||||||
|
Interest expense
|
$ (64,892.25)
|
|||||||||
|
|
Net income (loss) - GAAP basis
|
$ (38,280.53)
|
||||||||
|
Summary Statement of Cash Flows
|
||||||||||
|
|
Net cash flows provided by (used in) operating activities
|
$ 317,873.28
|
||||||||
|
Net cash flows provided by (used in) investing activities
|
$ (8,650.00)
|
|||||||||
|
|
Net cash flows provided by (used in) financing activities
|
$ -
|
||||||||
|
Amount and Source Distributions
|
||||||||||
|
|
Total distributions paid to common stockholders
|
$ -
|
||||||||
|
Distribution data per $1,000 invested
|
||||||||||
|
|
Total distributions paid to common stockholders
|
-
|
||||||||
|
From operations and sales of properties
|
-
|
|||||||||
|
|
|
From all other sources (financing or offering proceeds)
|
-
|
|||||||
|
Summary Balance Sheet
|
||||||||||
|
|
Total assets (before depreciation)
|
$ 15,175,679.85
|
||||||||
|
Total assets (after depreciation)
|
$ 15,124,582.85
|
|||||||||
|
|
Total liabilities
|
$ 8,179,556.44
|
||||||||
|
Estimated per share value
|
N/A
|
|||||||||
Page | 91
|
Pecos
|
||||||||||
|
Project 2
|
||||||||||
|
|
Period from Oct 29, 2015
|
|
||||||||
|
|
(Date of Inception) to
|
|
||||||||
|
Year Ended
|
Year Ended
|
Year Ended
|
Year Ended
|
Year Ended
|
Year Ended
|
|||||
|
Dec 31 2016
|
Dec 31,2015
|
Dec 31,2014
|
Dec 31,2013
|
Dec 31,2012
|
Dec 31,2011
|
|||||
|
Summary Operating Results
|
|
|
||||||||
|
|
Gross revenues
|
$ 1,584,499.15
|
$ 276,470.76
|
|
|
|
|
|||
|
Operating expenses
|
$ (683,365.97)
|
$ (111,140.58)
|
|
|
|
|
||||
|
|
Opearing income (loss)
|
$ 901,133.18
|
$ 165,330.18
|
|
|
|
|
|||
|
Interest expense
|
$ (226,266.72)
|
$ (37,513.07)
|
|
|
|
|
||||
|
|
Net income (loss) - GAAP basis
|
$ 67,250.22
|
$ 35,332.94
|
|
|
|
|
|||
|
Summary Statement of Cash Flows
|
|
|
|
|
|
|
||||
|
|
Net cash flows provided by (used in) operating activities
|
$ 1,366,888.59
|
$ 203,419.83
|
|
|
|
|
|||
|
Net cash flows provided by (used in) investing activities
|
$ (18,914.45)
|
$ (1,975.42)
|
|
|
|
|
||||
|
|
Net cash flows provided by (used in) financing activities
|
$ -
|
$ -
|
|
|
|
|
|||
|
Amount and Source Distributions
|
|
|
|
|
|
|
||||
|
|
Total distributions paid to common stockholders
|
$ 145,000.00
|
$ -
|
|
|
|
|
|||
|
Distribution data per $1,000 invested:
|
|
|
|
|
|
|
||||
|
|
Total distributions paid to common stockholders
|
145.00
|
-
|
|
|
|
|
|||
|
From operations and sales of properties
|
145.00
|
-
|
|
|
|
|
||||
|
|
|
From all other sources (financing or offering proceeds)
|
-
|
-
|
|
|
|
|
||
|
Summary Balance Sheet
|
|
|
|
|
|
|
||||
|
|
Total assets (before depreciation)
|
$ 13,531,998.06
|
$ 12,109,773.78
|
|
|
|
|
|||
|
Total assets (after depreciation)
|
$ 12,800,262.06
|
$ 12,024,322.78
|
|
|
|
|
||||
|
|
Total liabilities
|
$ 8,225,450.90
|
$ 8,208,989.84
|
|
|
|
|
|||
|
Estimated per share value
|
N/A
|
N/A
|
|
|
|
|
||||
Page | 92
|
Glen Rock
|
||||||||||
|
Project 3
|
||||||||||
|
Period from Aug 27, 2015
|
|
|||||||||
|
|
(Date of Inception) to
|
|
||||||||
|
Year Ended
|
Year Ended
|
Year Ended
|
Year Ended
|
Year Ended
|
Year Ended
|
|||||
|
Dec 31 2016
|
Dec 31,2015
|
Dec 31,2014
|
Dec 31,2013
|
Dec 31,2012
|
Dec 31,2011
|
|||||
|
Summary Operating Results
|
|
|
||||||||
|
|
Gross revenues
|
$ 3,984,832.49
|
$ 1,366,506.59
|
|
|
|
|
|||
|
Operating expenses
|
$ (1,765,222.94)
|
$ (598,694.00)
|
|
|
|
|
||||
|
|
Opearing income (loss)
|
$ 2,219,609.55
|
$ 767,812.59
|
|
|
|
|
|||
|
Interest expense
|
$ (1,377,345.92)
|
$ (496,554.31)
|
|
|
|
|
||||
|
|
Net income (loss) - GAAP basis
|
$ (1,717,059.23)
|
$ (87,193.61)
|
|
|
|
|
|||
|
Summary Statement of Cash Flows
|
|
|
|
|
|
|
||||
|
|
Net cash flows provided by (used in) operating activities
|
$ (859,258.09)
|
$ 462,399.44
|
|
|
|
|
|||
|
Net cash flows provided by (used in) investing activities
|
$ (239,546.61)
|
$ (9,578.28)
|
|
|
|
|
||||
|
|
Net cash flows provided by (used in) financing activities
|
$ 1,525,000.00
|
$ -
|
|
|
|
|
|||
|
Amount and Source Distributions
|
|
|
|
|
|
|
||||
|
|
Total distributions paid to common stockholders
|
$ 400,000.00
|
$ 100,000.00
|
|
|
|
|
|||
|
Distribution data per $1,000 invested:
|
|
|
|
|
|
|
||||
|
|
Total distributions paid to common stockholders
|
400.00
|
100.00
|
|
|
|
|
|||
|
From operations and sales of properties
|
400.00
|
100.00
|
|
|
|
|
||||
|
|
|
From all other sources (financing or offering proceeds)
|
-
|
-
|
|
|
|
|
||
|
Summary Balance Sheet
|
|
|
|
|
|
|
||||
|
|
Total assets (before depreciation)
|
$ 36,439,089.65
|
$ 38,240,133.78
|
|
|
|
|
|||
|
Total assets (after depreciation)
|
$ 36,467,245.93
|
$ 37,884,077.14
|
|
|
|
|
||||
|
|
Total liabilities
|
$ 28,806,939.77
|
$ 29,631,711.75
|
|
|
|
|
|||
|
Estimated per share value
|
N/A
|
N/A
|
|
|
|
|
||||
Page | 93
|
Pacific
|
||||||||||
|
Project 4
|
||||||||||
|
Period from Jan 14, 2015
|
|
|||||||||
|
|
(Date of Inception) to
|
|
||||||||
|
Year Ended
|
Year Ended
|
Year Ended
|
Year Ended
|
Year Ended
|
Year Ended
|
|||||
|
Dec 31 2016
|
Dec 31,2015
|
Dec 31,2014
|
Dec 31,2013
|
Dec 31,2012
|
Dec 31,2011
|
|||||
|
Summary Operating Results
|
|
|
||||||||
|
|
Gross revenues
|
$ 1,845,990.29
|
$ 1,607,984.89
|
|
|
|
|
|||
|
Operating expenses
|
$ (1,383,835.04)
|
$ (1,223,863.72)
|
|
|
|
|
||||
|
|
Opearing income (loss)
|
$ 462,155.25
|
$ 384,121.17
|
|
|
|
|
|||
|
Interest expense
|
$ (212,187.23)
|
$ (169,158.52)
|
|
|
|
|
||||
|
|
Net income (loss) - GAAP basis
|
$ (331,593.18)
|
$ (228,467.82)
|
|
|
|
|
|||
|
Summary Statement of Cash Flows
|
|
|
|
|
|
|
||||
|
|
Net cash flows provided by (used in) operating activities
|
$ 586,199.85
|
$ 745,445.04
|
|
|
|
|
|||
|
Net cash flows provided by (used in) investing activities
|
$ (242,906.49)
|
$ (546,240.12)
|
|
|
|
|
||||
|
|
Net cash flows provided by (used in) financing activities
|
$ -
|
$ -
|
|
|
|
|
|||
|
Amount and Source Distributions
|
|
|
|
|
|
|
||||
|
|
Total distributions paid to common stockholders
|
$ 147,900.00
|
$ 130,400.00
|
|
|
|
|
|||
|
Distribution data per $1,000 invested:
|
|
|
|
|
|
|
||||
|
|
Total distributions paid to common stockholders
|
147.90
|
130.40
|
|
|
|
|
|||
|
From operations and sales of properties
|
147.90
|
130.40
|
|
|
|
|
||||
|
|
|
From all other sources (financing or offering proceeds)
|
-
|
-
|
|
|
|
|
||
|
Summary Balance Sheet
|
|
|
|
|
|
|
||||
|
|
Total assets (before depreciation)
|
$ 5,892,370.40
|
$ 5,947,359.98
|
|
|
|
|
|||
|
Total assets (after depreciation)
|
$ 5,102,500.24
|
$ 5,588,389.86
|
|
|
|
|
||||
|
|
Total liabilities
|
$ 4,205,027.87
|
$ 4,211,424.31
|
|
|
|
|
|||
|
Estimated per share value
|
N/A
|
N/A
|
|
|
|
|
||||
Page | 94
|
Villas
|
||||||||||
|
Project 5
|
||||||||||
|
Period from Dec 31, 2014
|
|
|||||||||
|
|
(Date of Inception) to
|
|
||||||||
|
Year ended
|
Year Ended
|
Year Ended
|
Year Ended
|
Year Ended
|
Year Ended
|
|||||
|
Dec 31 2016
|
Dec 31,2015
|
Dec 31,2014
|
Dec 31,2013
|
Dec 31,2012
|
Dec 31,2011
|
|||||
|
Summary Operating Results
|
|
|
||||||||
|
|
Gross revenues
|
$ 1,864,191.05
|
$ 1,601,525.57
|
$ 206,245.65
|
|
|
|
|||
|
Operating expenses
|
$ (900,573.48)
|
$ (929,915.73)
|
$ (5,611.32)
|
|
|
|
||||
|
|
Opearing income (loss)
|
$ 963,617.57
|
$ 671,609.84
|
$ 200,634.33
|
|
|
|
|||
|
Interest expense
|
$ (228,581.68)
|
$ (231,551.29)
|
$ (15,335.71)
|
|
|
|
||||
|
|
Net income (loss) - GAAP basis
|
$ 777,476.90
|
$ 11,809.83
|
$ 107,155.62
|
|
|
|
|||
|
Summary Statement of Cash Flows
|
|
|
|
|
|
|
||||
|
|
Net cash flows provided by (used in) operating activities
|
$ 119,586.48
|
$ 419,010.50
|
$ (85,878.68)
|
|
|
|
|||
|
Net cash flows provided by (used in) investing activities
|
$ 614,349.59
|
$ (24,683.98)
|
$ (1,820,079.65)
|
|
|
|
||||
|
|
Net cash flows provided by (used in) financing activities
|
$ (218,054.00)
|
$ -
|
$ 2,084,870.75
|
|
|
|
|||
|
Amount and Source Distributions
|
|
|
|
|
|
|
||||
|
|
Total distributions paid to common stockholders
|
$ 300,000.00
|
$ 259,000.00
|
$ -
|
|
|
|
|||
|
Distribution data per $1,000 invested:
|
|
|
|
|
|
|
||||
|
|
Total distributions paid to common stockholders
|
300.00
|
259.00
|
-
|
|
|
|
|||
|
From operations and sales of properties
|
300.00
|
259.00
|
-
|
|
|
|
||||
|
|
|
From all other sources (financing or offering proceeds)
|
-
|
-
|
-
|
|
|
|
||
|
Summary Balance Sheet
|
|
|
|
|
|
|
||||
|
|
Total assets (before depreciation)
|
$ 7,366,309.45
|
$ 7,616,065.26
|
$ 7,274,601.82
|
|
|
|
|||
|
Total assets (after depreciation)
|
$ 7,364,632.69
|
$ 7,207,579.59
|
$ 7,266,458.82
|
|
|
|
||||
|
|
Total liabilities
|
$ 5,100,373.59
|
$ 5,202,743.39
|
$ 5,074,432.45
|
|
|
|
|||
|
Estimated per share value
|
N/A
|
N/A
|
N/A
|
|
|
|
||||
Page | 95
|
Racquet
|
||||||||||
|
Project 6
|
||||||||||
|
Period from Nov 25, 2014
|
|
|||||||||
|
|
(Date of Inception) to
|
|
||||||||
|
Year ended
|
Year Ended
|
Year Ended
|
Year Ended
|
Year Ended
|
Year Ended
|
|||||
|
Dec 31 2016
|
Dec 31,2015
|
Dec 31,2014
|
Dec 31,2013
|
Dec 31,2012
|
Dec 31,2011
|
|||||
|
Summary Operating Results
|
|
|
||||||||
|
|
Gross revenues
|
$ 2,265,687.92
|
$ 1,987,941.23
|
$ 200,136.41
|
|
|
|
|||
|
Operating expenses
|
$ (928,203.20)
|
$ (904,189.94)
|
$ (47,974.24)
|
|
|
|
||||
|
|
Opearing income (loss)
|
$ 1,337,484.72
|
$ 1,083,751.29
|
$ 152,162.17
|
|
|
|
|||
|
Interest expense
|
$ (644,697.04)
|
$ (644,018.21)
|
$ (74,106.21)
|
|
|
|
||||
|
|
Net income (loss) - GAAP basis
|
$ 92,026.44
|
$ (36,507.90)
|
$ 19,682.48
|
|
|
|
|||
|
Summary Statement of Cash Flows
|
|
|
|
|
|
|
||||
|
|
Net cash flows provided by (used in) operating activities
|
$ 411,979.41
|
$ 379,237.20
|
$ 320,649.57
|
|
|
|
|||
|
Net cash flows provided by (used in) investing activities
|
$ (32,674.37)
|
$ (2,194.94)
|
$ (12,610.30)
|
|
|
|
||||
|
|
Net cash flows provided by (used in) financing activities
|
$ -
|
$ -
|
$ -
|
|
|
|
|||
|
Amount and Source Distributions
|
|
|
|
|
|
|
||||
|
|
Total distributions paid to common stockholders
|
$ 275,000.00
|
$ 285,000.00
|
$ -
|
|
|
|
|||
|
Distribution data per $1,000 invested:
|
|
|
|
|
|
|
||||
|
|
Total distributions paid to common stockholders
|
275.00
|
285.00
|
-
|
|
|
|
|||
|
From operations and sales of properties
|
275.00
|
285.00
|
-
|
|
|
|
||||
|
|
|
From all other sources (financing or offering proceeds)
|
-
|
-
|
-
|
|
|
|
||
|
Summary Balance Sheet
|
|
|
|
|
|
|
||||
|
|
Total assets (before depreciation)
|
$ 15,495,039.96
|
$ 15,208,948.75
|
$ 15,060,178.77
|
|
|
|
|||
|
Total assets (after depreciation)
|
$ 14,494,082.21
|
$ 14,689,317.20
|
$ 15,004,902.42
|
|
|
|
||||
|
|
Total liabilities
|
$ 12,387,101.47
|
$ 12,399,362.90
|
$ 12,335,219.94
|
|
|
|
|||
|
Estimated per share value
|
N/A
|
N/A
|
N/A
|
|
|
|
||||
Page | 96
|
Anaheim
|
||||||||||
|
Project 7
|
||||||||||
|
Period from Oct 29, 2014
|
|
|||||||||
|
|
(Date of Inception) to
|
|
||||||||
|
Year ended
|
Year Ended
|
Year Ended
|
Year Ended
|
Year Ended
|
Year Ended
|
|||||
|
Dec 31 2016
|
Dec 31,2015
|
Dec 31,2014
|
Dec 31,2013
|
Dec 31,2012
|
Dec 31,2011
|
|||||
|
Summary Operating Results
|
|
|
||||||||
|
|
Gross revenues
|
$ 2,816,686.94
|
$ 2,876,746.33
|
$ 510,671.30
|
|
|
|
|||
|
Operating expenses
|
$ (1,088,304.05)
|
$ (1,361,413.00)
|
$ (161,177.04)
|
|
|
|
||||
|
|
Opearing income (loss)
|
$ 1,728,382.89
|
$ 1,515,333.33
|
$ 349,494.26
|
|
|
|
|||
|
Interest expense
|
$ (709,727.18)
|
$ (753,656.92)
|
$ (156,325.30)
|
|
|
|
||||
|
|
Net income (loss) - GAAP basis
|
$ 7,873,260.09
|
$ (661,456.68)
|
$ 10,406.39
|
|
|
|
|||
|
Summary Statement of Cash Flows
|
|
|
|
|
|
|
||||
|
|
Net cash flows provided by (used in) operating activities
|
$ 195,685.85
|
$ 401,960.30
|
$ 779,811.83
|
|
|
|
|||
|
Net cash flows provided by (used in) investing activities
|
$ (44,400.31)
|
$ 19,519.47
|
$ (289,956.70)
|
|
|
|
||||
|
|
Net cash flows provided by (used in) financing activities
|
$ -
|
$ -
|
$ 164,000.00
|
|
|
|
|||
|
Amount and Source Distributions
|
|
|
|
|
|
|
||||
|
|
Total distributions paid to common stockholders
|
$ 8,195,944.50
|
$ 650,000.00
|
$ 220,000.00
|
|
|
|
|||
|
Distribution data per $1,000 invested:
|
|
|
|
|
|
|
||||
|
|
Total distributions paid to common stockholders
|
8,195.94
|
650.00
|
220.00
|
|
|
|
|||
|
From operations and sales of properties
|
8,195.94
|
650.00
|
220.00
|
|
|
|
||||
|
|
|
From all other sources (financing or offering proceeds)
|
-
|
-
|
-
|
|
|
|
||
|
Summary Balance Sheet
|
|
|
|
|
|
|
||||
|
|
Total assets (before depreciation)
|
$ 17,274,860.32
|
$ 32,393,000.05
|
$ 31,457,965.76
|
|
|
|
|||
|
Total assets (after depreciation)
|
$ 16,266,338.37
|
$ 31,303,134.48
|
$ 31,310,628.40
|
|
|
|
||||
|
|
Total liabilities
|
$ 9,171,889.14
|
$ 23,886,000.84
|
$ 22,630,500.01
|
|
|
|
|||
|
Estimated per share value
|
|
N/A
|
N/A
|
|
|
|
||||
Page | 97
|
Siena
|
||||||||||
|
Project 8
|
||||||||||
|
Period from Oct 14, 2014
|
|
|||||||||
|
|
(Date of Inception) to
|
|
||||||||
|
Year Ended
|
Year Ended
|
Year Ended
|
Year Ended
|
Year Ended
|
Year Ended
|
|||||
|
Dec 31,2016
|
Dec 31,2015
|
Dec 31,2014
|
Dec 31,2013
|
Dec 31,2012
|
Dec 31,2011
|
|||||
|
Summary Operating Results
|
|
|
||||||||
|
|
Gross revenues
|
$ 1,827,526.71
|
$ 1,752,671.59
|
$ 362,035.88
|
|
|
|
|||
|
Operating expenses
|
$ (850,957.32)
|
$ (886,999.94)
|
$ (163,486.67)
|
|
|
|
||||
|
|
Opearing income (loss)
|
$ 976,569.39
|
$ 865,671.65
|
$ 198,549.21
|
|
|
|
|||
|
Interest expense
|
$ (235,994.44)
|
$ (209,235.29)
|
$ (26,887.81)
|
|
|
|
||||
|
|
Net income (loss) - GAAP basis
|
$ 106,078.83
|
$ (6,508.31)
|
$ 57,501.69
|
|
|
|
|||
|
Summary Statement of Cash Flows
|
|
|
|
|
|
|
||||
|
|
Net cash flows provided by (used in) operating activities
|
$ 442,630.21
|
$ 243,582.06
|
$ 274,206.73
|
|
|
|
|||
|
Net cash flows provided by (used in) investing activities
|
$ (27,988.45)
|
$ (19,742.59)
|
$ (18,267.77)
|
|
|
|
||||
|
|
Net cash flows provided by (used in) financing activities
|
$ -
|
$ -
|
$ -
|
|
|
|
|||
|
Amount and Source Distributions
|
|
|
|
|
|
|
||||
|
|
Total distributions paid to common stockholders
|
$ 460,000.00
|
$ 515,000.00
|
$ 140,000.00
|
|
|
|
|||
|
Distribution data per $1,000 invested:
|
|
|
|
|
|
|
||||
|
|
Total distributions paid to common stockholders
|
460.00
|
515.00
|
140.00
|
|
|
|
|||
|
From operations and sales of properties
|
460.00
|
515.00
|
140.00
|
|
|
|
||||
|
|
|
From all other sources (financing or offering proceeds)
|
-
|
-
|
-
|
|
|
|
||
|
Summary Balance Sheet
|
|
|
|
|
|
|
||||
|
|
Total assets (before depreciation)
|
$ 15,740,860.10
|
$ 14,908,209.75
|
$ 14,902,839.02
|
|
|
|
|||
|
Total assets (after depreciation)
|
$ 13,161,030.18
|
$ 14,232,033.7
|
$ 14,793,227.58
|
|
|
|
||||
|
|
Total liabilities
|
$ 9,210,411.93
|
$ 9,175,292.92
|
$ 9,175,725.89
|
|
|
|
|||
|
Estimated per share value
|
N/A
|
N/A
|
N/A
|
|
|
|
||||
Page | 98
|
BIG 22
|
||||||||||
|
Project 9
|
||||||||||
|
|
Period from Sep 19, 2014
|
|
||||||||
|
|
(Date of Inception) to
|
|
||||||||
|
Year Ended
|
Year Ended
|
Year Ended
|
Year Ended
|
Year Ended
|
Year Ended
|
|||||
|
Dec 31,2016
|
Dec 31,2015
|
Dec 31,2014
|
Dec 31,2013
|
Dec 31,2012
|
Dec 31,2011
|
|||||
|
Summary Operating Results
|
|
|
||||||||
|
|
Gross revenues
|
$ 32,496,003.32
|
$ 30,595,854.20
|
$ 12,185,020.56
|
|
|
|
|||
|
Operating expenses
|
$ (17,792,562.22)
|
$ (18,236,939.32)
|
$ (7,486,166.62)
|
|
|
|
||||
|
|
Opearing income (loss)
|
$ 14,703,441.10
|
$ 12,358,914.88
|
$ 4,698,853.94
|
|
|
|
|||
|
Interest expense
|
$ (11,114,320.79)
|
$ (10,345,656.61)
|
$ (4,721,397.96)
|
|
|
|
||||
|
|
Net income (loss) - GAAP basis
|
$ (7,549,342.50)
|
$ (7,240,498.21)
|
$ (3,459,127.10)
|
|
|
|
|||
|
Summary Statement of Cash Flows
|
|
|
|
|
|
|
||||
|
|
Net cash flows provided by (used in) operating activities
|
$ 1,679,768.59
|
$ 701,922.90
|
$ 13,721,761.49
|
|
|
|
|||
|
Net cash flows provided by (used in) investing activities
|
$ 69,419.58
|
$ 1,423,295.88
|
$ (1,456,428.02)
|
|
|
|
||||
|
|
Net cash flows provided by (used in) financing activities
|
$ -
|
|
$ -
|
|
|
|
|||
|
Amount and Source Distributions
|
|
|
|
|
|
|
||||
|
|
Total distributions paid to common stockholders
|
$ 2,500,000.00
|
$ 1,200,000.00
|
$ 402,000.00
|
|
|
|
|||
|
Distribution data per $1,000 invested:
|
|
|
|
|
|
|
||||
|
|
Total distributions paid to common stockholders
|
2,500.00
|
1,200.00
|
402.00
|
|
|
|
|||
|
From operations and sales of properties
|
2,500.00
|
1,200.00
|
402.00
|
|
|
|
||||
|
|
|
From all other sources (financing or offering proceeds)
|
-
|
-
|
-
|
|
|
|
||
|
Summary Balance Sheet
|
|
|
|
|
|
|
||||
|
|
Total assets (before depreciation)
|
$ 236,616,367.16
|
$ 232,955,143.66
|
$ 234,424,016.20
|
|
|
|
|||
|
Total assets (after depreciation)
|
$ 218,962,626.31
|
$ 222,747,818.33
|
$ 231,460,088.20
|
|
|
|
||||
|
|
Total liabilities
|
$ 196,841,990.10
|
$ 190,577,839.62
|
$ 189,909,309.55
|
|
|
|
|||
|
Estimated per share value
|
N/A
|
N/A
|
N/A
|
|
|
|
||||
Page | 99
|
BedNOLA
|
||||||||||
|
Project 10
|
||||||||||
|
|
Period from Dec 23, 2013
|
|
||||||||
|
|
(Date of Inception) to
|
|
||||||||
|
Year Ended
|
Year Ended
|
Year Ended
|
Year Ended
|
Year Ended
|
Year Ended
|
|||||
|
Dec 31,2016
|
Dec 31,2015
|
Dec 31,2014
|
Dec 31,2013
|
Dec 31,2012
|
Dec 31,2011
|
|||||
|
Summary Operating Results
|
|
|
||||||||
|
|
Gross revenues
|
$ 3,291,182.05
|
$ 3,742,795.45
|
$ 3,446,045.97
|
$ 83,531.56
|
|
|
|||
|
Operating expenses
|
$ (1,715,544.73)
|
$ (2,005,092.26)
|
$ (1,909,215.90)
|
$ (88,014.63)
|
|
|
||||
|
|
Opearing income (loss)
|
$ 1,575,637.32
|
$ 1,737,703.19
|
$ 1,536,830.07
|
$ (4,483.07)
|
|
|
|||
|
Interest expense
|
$ (589,477.48)
|
$ (694,560.35)
|
$ (700,760.03)
|
$ (23,113.54)
|
|
|
||||
|
|
Net income (loss) - GAAP basis
|
$ 2,238,547.40
|
$ 56,214.56
|
$ 79,177.41
|
$ (49,852.61)
|
|
|
|||
|
Summary Statement of Cash Flows
|
|
|
|
|
|
|
||||
|
|
Net cash flows provided by (used in) operating activities
|
$ 289,597.71
|
$ 348,446.23
|
$ 888,207.08
|
$ (66,309.88)
|
|
|
|||
|
Net cash flows provided by (used in) investing activities
|
$ 2,601.13
|
$ 8,074.52
|
$ (139,324.26)
|
$ (6,096,925.61)
|
|
|
||||
|
|
Net cash flows provided by (used in) financing activities
|
$ (3,687.04)
|
$ -
|
$ -
|
$ 7,236,947.00
|
|
|
|||
|
Amount and Source Distributions
|
|
|
|
|
|
|
||||
|
|
Total distributions paid to common stockholders
|
$ 5,762,787.22
|
$ 770,000.00
|
$ 754,000.00
|
$ -
|
|
|
|||
|
Distribution data per $1,000 invested:
|
|
|
|
|
|
|
||||
|
|
Total distributions paid to common stockholders
|
5,762.79
|
770.00
|
754.00
|
-
|
|
|
|||
|
From operations and sales of properties
|
5,762.79
|
770.00
|
754.00
|
-
|
|
|
||||
|
|
|
From all other sources (financing or offering proceeds)
|
-
|
-
|
-
|
-
|
|
|
||
|
Summary Balance Sheet
|
|
|
|
|
|
|
||||
|
|
Total assets (before depreciation)
|
$ 13,437,761.69
|
$ 18,456,448.68
|
$ 20,980,290.00
|
$ 20,757,785.20
|
|
|
|||
|
Total assets (after depreciation)
|
$ 12,267,412.81
|
$ 19,702,065.10
|
$ 20,407,157.00
|
$ 20,735,529.20
|
|
|
||||
|
|
Total liabilities
|
$ 9,811,166.27
|
$ 13,721,578.74
|
$ 13,699,885.20
|
$ 13,548,434.81
|
|
|
|||
|
Estimated per share value
|
N/A
|
N/A
|
N/A
|
N/A
|
|
|
||||
Page | 100
|
Deerfield
|
||||||||||
|
Project 11
|
||||||||||
|
Period from Aug 30, 2013
|
|
|||||||||
|
|
(Date of Inception) to
|
|
||||||||
|
Year Ended
|
Year Ended
|
Year Ended
|
Year Ended
|
Year Ended
|
||||||
|
Dec 31,2015
|
Dec 31,2014
|
Dec 31,2013
|
Dec 31,2012
|
Dec 31,2011
|
||||||
|
Summary Operating Results
|
|
|
||||||||
|
|
Gross revenues
|
$ 864,992.77
|
$ 1,871,830.08
|
$ 590,496.54
|
|
|
||||
|
Operating expenses
|
$ (389,836.13)
|
$ (1,047,668.17)
|
$ (326,082.17)
|
|
|
|||||
|
|
Opearing income (loss)
|
$ 475,156.64
|
$ 824,161.91
|
$ 264,414.37
|
|
|
||||
|
Interest expense
|
$ (335,060.40)
|
$ (368,234.33)
|
$ (126,482.20)
|
|
|
|||||
|
|
Net income (loss) - GAAP basis
|
$ 77,059.81
|
$ 62,511.05
|
$ (29,680.47)
|
|
|
||||
|
Summary Statement of Cash Flows
|
|
|
|
|
|
|||||
|
|
Net cash flows provided by (used in) operating activities
|
$ 76,732.71
|
$ 1,039,222.60
|
$ 1,586,101.33
|
|
|
||||
|
Net cash flows provided by (used in) investing activities
|
$ (17,995.34)
|
$ (65,038.73)
|
$ (94,056.73)
|
|
|
|||||
|
|
Net cash flows provided by (used in) financing activities
|
$ -
|
$ -
|
$ -
|
|
|
||||
|
Amount and Source Distributions
|
|
|
|
|
|
|||||
|
|
Total distributions paid to common stockholders
|
$ 475,000.00
|
$ 317,000.00
|
$ -
|
|
|
||||
|
Distribution data per $1,000 invested:
|
|
|
|
|
|
|||||
|
|
Total distributions paid to common stockholders
|
475.00
|
317.00
|
-
|
|
|
||||
|
From operations and sales of properties
|
475.00
|
317.00
|
-
|
|
|
|||||
|
|
|
From all other sources (financing or offering proceeds)
|
-
|
-
|
-
|
|
|
|||
|
Summary Balance Sheet
|
|
|
|
|
|
|||||
|
|
Total assets (before depreciation)
|
$ 12,601,315.14
|
$ 13,058,957.17
|
$ 13,084,504.44
|
|
|
||||
|
Total assets (after depreciation)
|
$ 12,114,824.07
|
$ 12,577,917.25
|
$ 12,957,245.52
|
|
|
|||||
|
|
Total liabilities
|
$ 8,299,859.49
|
$ 7,954,250.97
|
$ 8,079,090.29
|
|
|
||||
|
Estimated per share value
|
N/A
|
N/A
|
N/A
|
|
|
|||||
Page | 101
|
Harvest Glen
|
||||||||||
|
Project 12
|
||||||||||
|
Period from Jun 21, 2013
|
|
|||||||||
|
|
(Date of Inception) to
|
|
||||||||
|
Year Ended
|
Year Ended
|
Year Ended
|
Year Ended
|
Year Ended
|
||||||
|
Dec 31,2015
|
Dec 31,2014
|
Dec 31,2013
|
Dec 31,2012
|
Dec 31,2011
|
||||||
|
Summary Operating Results
|
|
|
||||||||
|
|
Gross revenues
|
$ 1,251,636.16
|
$ 3,540,559.11
|
$ 1,500,446.05
|
|
|
||||
|
Operating expenses
|
$ (562,535.60)
|
$ (1,563,478.22)
|
$ (789,355.34)
|
|
|
|||||
|
|
Opearing income (loss)
|
$ 689,100.56
|
$ 1,977,080.89
|
$ 711,090.71
|
|
|
||||
|
Interest expense
|
$ (364,114.23)
|
$ (1,118,862.67)
|
$ (601,432.31)
|
|
|
|||||
|
|
Net income (loss) - GAAP basis
|
$ 213,149.58
|
$ (225,942.30)
|
$ (694,978.02)
|
|
|
||||
|
Summary Statement of Cash Flows
|
|
|
|
|
|
|||||
|
|
Net cash flows provided by (used in) operating activities
|
$ 128,829.85
|
$ 650,577.97
|
$ 1,250,643.60
|
|
|
||||
|
Net cash flows provided by (used in) investing activities
|
$ -
|
$ (142,855.58)
|
$ (31,514.52)
|
|
|
|||||
|
|
Net cash flows provided by (used in) financing activities
|
$ -
|
$ -
|
$ -
|
|
|
||||
|
Amount and Source Distributions
|
|
|
|
|
|
|||||
|
|
Total distributions paid to common stockholders
|
$ 290,000.00
|
$ 414,498.59
|
$ -
|
|
|
||||
|
Distribution data per $1,000 invested:
|
|
|
|
|
|
|||||
|
|
Total distributions paid to common stockholders
|
290.00
|
414.50
|
-
|
|
|
||||
|
From operations and sales of properties
|
290.00
|
414.50
|
-
|
|
|
|||||
|
|
|
From all other sources (financing or offering proceeds)
|
-
|
-
|
-
|
|
|
|||
|
Summary Balance Sheet
|
|
|
|
|
|
|||||
|
|
Total assets (before depreciation)
|
$ 29,458,944.45
|
$ 29,598,687.11
|
$ 29,670,281.66
|
|
|
||||
|
Total assets (after depreciation)
|
$ 27,970,847.88
|
$ 28,142,740.79
|
$ 29,170,962.34
|
|
|
|||||
|
|
Total liabilities
|
$ 19,770,147.86
|
$ 19,865,491.34
|
$ 20,253,731.90
|
|
|
||||
|
Estimated per share value
|
N/A
|
N/A
|
N/A
|
|
|
|||||
Page | 102
|
PDP
|
||||||||||
|
Project 13
|
||||||||||
|
Period from May 17, 2013
|
||||||||||
|
|
(Date of Inception) to
|
|||||||||
|
Year Ended
|
Year Ended
|
Year Ended
|
Year Ended
|
Year Ended
|
||||||
|
Dec 31,2015
|
Dec 31,2014
|
Dec 31,2013
|
Dec 31,2012
|
Dec 31,2011
|
||||||
|
Summary Operating Results
|
|
|||||||||
|
|
Gross revenues
|
$ 834,083.45
|
$ 2,334,414.23
|
$ 1,368,231.76
|
|
|
||||
|
Operating expenses
|
$ (313,145.85)
|
$ (1,102,625.44)
|
$ (625,803.93)
|
|
|
|||||
|
|
Opearing income (loss)
|
$ 520,937.60
|
$ 1,231,788.79
|
$ 742,427.83
|
|
|
||||
|
Interest expense
|
$ (157,417.34)
|
$ (483,151.66)
|
$ (303,733.51)
|
|
|
|||||
|
|
Net income (loss) - GAAP basis
|
$ 345,191.96
|
$ 164,761.25
|
$ 86,291.92
|
|
|
||||
|
Summary Statement of Cash Flows
|
|
|
|
|
|
|||||
|
|
Net cash flows provided by (used in) operating activities
|
$ 398,776.56
|
$ (1,549,497.29)
|
$ 551,205.16
|
|
|
||||
|
Net cash flows provided by (used in) investing activities
|
$ (48,606.92)
|
$ 1,748,809.82
|
$ (57,620.01)
|
|
|
|||||
|
|
Net cash flows provided by (used in) financing activities
|
$ (100,000.00)
|
$ -
|
$ -
|
|
|
||||
|
Amount and Source Distributions
|
|
|
|
|
|
|||||
|
|
Total distributions paid to common stockholders
|
$ 200,000.00
|
$ 428,915.99
|
$ 163,000.00
|
|
|
||||
|
Distribution data per $1,000 invested:
|
|
|
|
|
|
|||||
|
|
Total distributions paid to common stockholders
|
200.00
|
428.92
|
163.00
|
|
|
||||
|
From operations and sales of properties
|
200.00
|
428.92
|
163.00
|
|
|
|||||
|
|
|
From all other sources (financing or offering proceeds)
|
-
|
-
|
-
|
|
|
|||
|
Summary Balance Sheet
|
|
|
|
|
|
|||||
|
|
Total assets (before depreciation)
|
$ 15,608,290.11
|
$ 15,586,086.56
|
$ 15,356,984.10
|
|
|
||||
|
Total assets (after depreciation)
|
$ 14,815,129.11
|
$ 14,762,767.16
|
$ 15,060,223.10
|
|
|
|||||
|
|
Total liabilities
|
$ 10,807,283.98
|
$ 10,900,113.99
|
$ 10,822,331.18
|
|
|
||||
|
Estimated per share value
|
N/A
|
N/A
|
N/A
|
|
|
|||||
Page | 103
|
DFW 5
|
||||||||||
|
Project 14
|
||||||||||
|
|
Period from Oct 31, 2012
|
|
||||||||
|
|
(Date of Inception) to
|
|
||||||||
|
Year Ended
|
Year Ended
|
Year Ended
|
Year Ended
|
Year Ended
|
Year Ended
|
|||||
|
Dec 31 2016
|
Dec 31,2015
|
Dec 31,2014
|
Dec 31,2013
|
Dec 31,2012
|
Dec 31,2011
|
|||||
|
Summary Operating Results
|
|
|
||||||||
|
|
Gross revenues
|
$ 4,715,148.06
|
$ 8,960,854.37
|
$ 9,714,692.04
|
$ 7,487,444.99
|
$ 1,150,023.15
|
|
|||
|
Operating expenses
|
$ (2,521,301.18)
|
$ (4,595,521.48)
|
$ (5,822,652.00)
|
$ (4,949,629.72)
|
$ (705,368.24)
|
|
||||
|
|
Opearing income (loss)
|
$ 2,193,846.88
|
$ 4,365,332.89
|
$ 3,892,040.04
|
$ 2,537,815.27
|
$ 444,654.91
|
|
|||
|
Interest expense
|
$ (1,010,590.88)
|
$ (2,589,488.87)
|
$ (2,124,495.96)
|
$ (1,855,275.21)
|
$ (298,200.00)
|
|
||||
|
|
Net income (loss) - GAAP basis
|
$ 19,775,252.16
|
$ (740,654.05)
|
$ 4,290,742.16
|
$ (156,813.04)
|
$ 93,678.20
|
|
|||
|
Summary Statement of Cash Flows
|
|
|
|
|
|
|
||||
|
|
Net cash flows provided by (used in) operating activities
|
$ (13,256,615.68)
|
$ 653,978.14
|
$ 3,384,029.14
|
$ 5,438,362.81
|
$ 13,665,376.32
|
|
|||
|
Net cash flows provided by (used in) investing activities
|
$ 13,924,795.81
|
$ (89,031.06)
|
$ 7,626,675.52
|
$ 746,681.89
|
$ (798,625.23)
|
|
||||
|
|
Net cash flows provided by (used in) financing activities
|
$ -
|
$ -
|
$ (9,466,577.80)
|
$ -
|
$ -
|
|
|||
|
Amount and Source Distributions
|
|
|
|
|
|
|
||||
|
|
Total distributions paid to common stockholders
|
$ 17,002,620.31
|
$ 1,686,547.00
|
$ 20,669,997.99
|
$ 356,000.00
|
$ 125,000.00
|
|
|||
|
Distribution data per $1,000 invested:
|
|
|
|
|
|
|
||||
|
|
Total distributions paid to common stockholders
|
17,002.62
|
1,686.55
|
20,670.00
|
356.00
|
125.00
|
|
|||
|
From operations and sales of properties
|
17,002.62
|
1,686.55
|
917.18
|
356.00
|
125.00
|
|
||||
|
|
|
From all other sources (financing or offering proceeds)
|
-
|
-
|
19,752.82
|
-
|
-
|
|
||
|
Summary Balance Sheet
|
|
|
|
|
|
|
||||
|
|
Total assets (before depreciation)
|
$ 670,257.27
|
$ 53,328,062.78
|
$ 49,681,337.53
|
$ 65,506,286.23
|
$ 59,149,965.44
|
|
|||
|
Total assets (after depreciation)
|
$ 670,257.27
|
$ 46,871,333.63
|
$ 45,085,070.29
|
$ 64,999,500.25
|
$ 59,115,909.90
|
|
||||
|
|
Total liabilities
|
$ 8,463.32
|
$ 48,982,171.53
|
$ 48,461,462.43
|
$ 46,081,016.66
|
$ 41,246,159.70
|
|
|||
|
Estimated per share value
|
N/A
|
N/A
|
N/A
|
N/A
|
N/A
|
|
||||
Page | 104
|
Kingston
|
||||||||||
|
Project 15
|
||||||||||
|
Period from Sep 11, 2012
|
|
|||||||||
|
|
(Date of Inception) to
|
|
||||||||
|
Year Ended
|
Year Ended
|
Year Ended
|
Year Ended
|
Year Ended
|
||||||
|
Dec 31,2015
|
Dec 31,2014
|
Dec 31,2013
|
Dec 31,2012
|
Dec 31,2011
|
||||||
|
Summary Operating Results
|
|
|
||||||||
|
|
Gross revenues
|
$ 400,443.52
|
$ 1,210,293.33
|
$ 1,162,880.33
|
$ 334,048.12
|
|
||||
|
Operating expenses
|
$ (256,536.14)
|
$ (729,235.24)
|
$ (705,803.52)
|
$ (197,099.77)
|
|
|||||
|
|
Opearing income (loss)
|
$ 143,907.38
|
$ 481,058.09
|
$ 457,076.81
|
$ 136,948.35
|
|
||||
|
Interest expense
|
$ (85,782.37)
|
$ (328,600.36)
|
$ (364,619.80)
|
$ (111,883.34)
|
|
|||||
|
|
Net income (loss) - GAAP basis
|
$ 45,903.63
|
$ (79,885.74)
|
$ (141,859.17)
|
$ (48,738.36)
|
|
||||
|
Summary Statement of Cash Flows
|
|
|
|
|
|
|||||
|
|
Net cash flows provided by (used in) operating activities
|
$ 194,348.06
|
$ 178,415.20
|
$ 295,177.37
|
$ 918,948.08
|
|
||||
|
Net cash flows provided by (used in) investing activities
|
$ (23,850.77)
|
$ 43,381.74
|
$ (3,490.23)
|
$ (28,648.38)
|
|
|||||
|
|
Net cash flows provided by (used in) financing activities
|
$ -
|
$ -
|
$ -
|
$ -
|
|
||||
|
Amount and Source Distributions
|
|
|
|
|
|
|||||
|
|
Total distributions paid to common stockholders
|
$ 20,000.00
|
$ 1,510,000.00
|
$ 132,000.00
|
$ -
|
|
||||
|
Distribution data per $1,000 invested:
|
|
|
|
|
|
|||||
|
|
Total distributions paid to common stockholders
|
20.00
|
1,510.00
|
132.00
|
-
|
|
||||
|
From operations and sales of properties
|
20.00
|
120.00
|
132.00
|
-
|
|
|||||
|
|
|
From all other sources (financing or offering proceeds)
|
-
|
1,390.00
|
-
|
-
|
|
|||
|
Summary Balance Sheet
|
|
|
|
|
|
|||||
|
|
Total assets (before depreciation)
|
$ 6,023,260.97
|
$ 5,973,438.22
|
$ 5,562,310.61
|
$ 5,691,379.55
|
|
||||
|
Total assets (after depreciation)
|
$ 5,638,283.73
|
$ 5,594,675.10
|
$ 5,360,787.61
|
$ 5,637,555.03
|
|
|||||
|
|
Total liabilities
|
$ 5,341,863.37
|
$ 5,324,158.37
|
$ 3,500,385.14
|
$ 3,503,293.39
|
|
||||
|
Estimated per share value
|
N/A
|
N/A
|
N/A
|
N/A
|
|
|||||
Page | 105
|
Sedona
|
||||||||||
|
Project 16
|
||||||||||
|
|
Period from Aug 6, 2012
|
|
||||||||
|
|
(Date of Inception) to
|
|
||||||||
|
Year Ended
|
Year Ended
|
Year Ended
|
Year Ended
|
Year Ended
|
||||||
|
Dec 31,2015
|
Dec 31,2014
|
Dec 31,2013
|
Dec 31,2012
|
Dec 31,2011
|
||||||
|
Summary Operating Results
|
|
|
||||||||
|
|
Gross revenues
|
$ 1,337,296.71
|
$ 1,649,279.93
|
$ 1,388,731.83
|
$ 568,104.84
|
|
||||
|
Operating expenses
|
$ (669,426.66)
|
$ (879,139.26)
|
$ (965,797.91)
|
$ (335,079.53)
|
|
|||||
|
|
Opearing income (loss)
|
$ 667,870.05
|
$ 770,140.67
|
$ 422,933.92
|
$ 233,025.31
|
|
||||
|
Interest expense
|
$ 1,183,936.90
|
$ (290,104.03)
|
$ (290,104.03)
|
$ (117,631.22)
|
|
|||||
|
|
Net income (loss) - GAAP basis
|
$ 2,967,751.78
|
$ 127,588.69
|
$ (202,582.24)
|
$ 14,102.67
|
|
||||
|
Summary Statement of Cash Flows
|
|
|
|
|
|
|||||
|
|
Net cash flows provided by (used in) operating activities
|
$ 642,174.84
|
$ 313,229.70
|
$ 161,594.22
|
$ 192,651.89
|
|
||||
|
Net cash flows provided by (used in) investing activities
|
$ -
|
$ (142,267.56)
|
$ (102,423.16)
|
$ (498.53)
|
|
|||||
|
|
Net cash flows provided by (used in) financing activities
|
$ -
|
$ -
|
$ -
|
$ -
|
|
||||
|
Amount and Source Distributions
|
|
|
|
|
|
|||||
|
|
Total distributions paid to common stockholders
|
$ 178,000.00
|
$ 110,000.00
|
$ 135,000.01
|
$ 35,000.00
|
|
||||
|
Distribution data per $1,000 invested:
|
|
|
|
|
|
|||||
|
|
Total distributions paid to common stockholders
|
178.00
|
110.00
|
135.00
|
35.00
|
|
||||
|
From operations and sales of properties
|
178.00
|
110.00
|
135.00
|
35.00
|
|
|||||
|
|
|
From all other sources (financing or offering proceeds)
|
-
|
-
|
-
|
-
|
|
|||
|
Summary Balance Sheet
|
|
|
|
|
|
|||||
|
|
Total assets (before depreciation)
|
$ -
|
$ 10,424,733.01
|
$ 9,654,269.72
|
$ 10,115,492.85
|
|
||||
|
Total assets (after depreciation)
|
$ -
|
$ 9,749,651.23
|
$ 10,032,869.66
|
$ 10,022,266.75
|
|
|||||
|
|
Total liabilities
|
$ 5,260.20
|
$ 7,403,542.12
|
$ 7,704,349.24
|
$ 7,356,164.08
|
|
||||
|
Estimated per share value
|
N/A
|
N/A
|
N/A
|
N/A
|
|
|||||
Page | 106
|
Lake Sahara
|
||||||||||
|
Project 17
|
||||||||||
|
|
Period from
Jul 16, 2012 |
|
||||||||
|
|
(Date of Inception) to
|
|
||||||||
|
Year Ended
|
Year Ended
|
Year Ended
|
Year Ended
|
Year Ended
|
||||||
|
Dec 31,2015
|
Dec 31,2014
|
Dec 31,2013
|
Dec 31,2012
|
Dec 31,2011
|
||||||
|
Summary Operating Results
|
|
|
||||||||
|
|
Gross revenues
|
$ 1,342,515.52
|
$ 1,961,983.63
|
$ 1,714,098.72
|
$ 656,003.78
|
|
||||
|
Operating expenses
|
$ (767,952.63)
|
$ (1,161,662.09)
|
$ (1,047,103.07)
|
$ (398,691.61)
|
|
|||||
|
|
Opearing income (loss)
|
$ 574,562.89
|
$ 800,321.54
|
$ 666,995.65
|
$ 257,312.17
|
|
||||
|
Interest expense
|
$ (334,272.50)
|
$ (499,996.68)
|
$ (502,672.50)
|
$ (245,035.39)
|
|
|||||
|
|
Net income (loss) - GAAP basis
|
$ 3,448,835.31
|
$ (119,395.67)
|
$ (253,654.80)
|
$ (125,464.56)
|
|
||||
|
Summary Statement of Cash Flows
|
|
|
|
|
|
|||||
|
|
Net cash flows provided by (used in) operating activities
|
$ (372,021.08)
|
$ 114,705.17
|
$ 845,381.86
|
$ 699,441.37
|
|
||||
|
Net cash flows provided by (used in) investing activities
|
$ -
|
$ (3,216.20)
|
$ (786,868.97)
|
$ (568,068.48)
|
|
|||||
|
|
Net cash flows provided by (used in) financing activities
|
$ 372,021.08
|
$ -
|
$ -
|
$ -
|
|
||||
|
Amount and Source Distributions
|
|
|
|
|
|
|||||
|
|
Total distributions paid to common stockholders
|
$ -
|
$ 160,000.00
|
$ -
|
$ -
|
|
||||
|
Distribution data per $1,000 invested:
|
|
|
|
|
|
|||||
|
|
Total distributions paid to common stockholders
|
-
|
160.00
|
-
|
-
|
|
||||
|
From operations and sales of properties
|
-
|
160.00
|
-
|
-
|
|
|||||
|
|
|
From all other sources (financing or offering proceeds)
|
-
|
-
|
-
|
-
|
|
|||
|
Summary Balance Sheet
|
|
|
|
|
|
|||||
|
|
Total assets (before depreciation)
|
$ -
|
$ 11,783,520.31
|
$ 11,758,653.18
|
$ 11,667,927.81
|
|
||||
|
Total assets (after depreciation)
|
$ -
|
$ 10,995,347.61
|
$ 11,313,904.16
|
$ 11,541,210.47
|
|
|||||
|
|
Total liabilities
|
$ -
|
$ 7,840,861.92
|
$ 7,910,022.82
|
$ 7,883,674.33
|
|
||||
|
Estimated per share value
|
N/A
|
N/A
|
N/A
|
N/A
|
|
|||||
Page | 107
|
HHH
|
||||||||||
|
Project 18
|
||||||||||
|
Period from
Jun 28, 2012 |
|
|||||||||
|
|
(Date of Inception) to
|
|
||||||||
|
Year Ended
|
Year Ended
|
Year Ended
|
Year Ended
|
Year Ended
|
||||||
|
Dec 31,2015
|
Dec 31,2014
|
Dec 31,2013
|
Dec 31,2012
|
Dec 31,2011
|
||||||
|
Summary Operating Results
|
|
|
||||||||
|
|
Gross revenues
|
$ 2,226,423.46
|
$ 6,272,857.72
|
$ 5,842,009.73
|
$ 2,728,579.16
|
|
||||
|
Operating expenses
|
$ (1,677,298.71)
|
$ (3,259,935.95)
|
$ (3,239,135.45)
|
$ (1,705,040.90)
|
|
|||||
|
|
Opearing income (loss)
|
$ 549,124.75
|
$ 3,012,921.77
|
$ 2,602,874.28
|
$ 1,023,538.26
|
|
||||
|
Interest expense
|
$ (490,225.57)
|
$ (1,494,207.81)
|
$ (1,494,207.81)
|
$ (765,525.64)
|
|
|||||
|
|
Net income (loss) - GAAP basis
|
$ (206,055.72)
|
$ (242,655.48)
|
$ (692,396.53)
|
$ (596,692.73)
|
|
||||
|
Summary Statement of Cash Flows
|
|
|
|
|
|
|||||
|
|
Net cash flows provided by (used in) operating activities
|
$ 5,901.18
|
$ 1,119,504.05
|
$ 292,185.97
|
$ 1,435,651.49
|
|
||||
|
Net cash flows provided by (used in) investing activities
|
$ -
|
$ (328,525.45)
|
$ (14,530.38)
|
$ (371,139.95)
|
|
|||||
|
|
Net cash flows provided by (used in) financing activities
|
$ -
|
$ -
|
$ -
|
$ -
|
|
||||
|
Amount and Source Distributions
|
|
|
|
|
|
|||||
|
|
Total distributions paid to common stockholders
|
$ 745,000.00
|
$ 700,000.00
|
$ 879,500.01
|
$ 243,615.00
|
|
||||
|
Distribution data per $1,000 invested:
|
|
|
|
|
|
|||||
|
|
Total distributions paid to common stockholders
|
745.00
|
700.00
|
879.50
|
243.62
|
|
||||
|
From operations and sales of properties
|
745.00
|
700.00
|
879.50
|
243.62
|
|
|||||
|
|
|
From all other sources (financing or offering proceeds)
|
-
|
-
|
-
|
-
|
|
|||
|
Summary Balance Sheet
|
|
|
|
|
|
|||||
|
|
Total assets (before depreciation)
|
$ 46,688,302.81
|
$ 47,964,661.11
|
$ 47,518,429.63
|
$ 47,767,977.61
|
|
||||
|
Total assets (after depreciation)
|
$ 42,590,069.95
|
$ 43,920,817.31
|
$ 45,047,355.35
|
$ 46,951,340.85
|
|
|||||
|
|
Total liabilities
|
$ 35,909,726.79
|
$ 36,033,462.38
|
$ 36,217,344.94
|
$ 36,549,433.90
|
|
||||
|
Estimated per share value
|
N/A
|
N/A
|
N/A
|
N/A
|
|
|||||
Page | 108
|
VDP
|
||||||||||
|
Project 19
|
||||||||||
|
|
Period from
Jun 14, 2012 |
|
||||||||
|
|
(Date of Inception) to
|
|
||||||||
|
Year Ended
|
Year Ended
|
Year Ended
|
Year Ended
|
Year Ended
|
||||||
|
Dec 31,2015
|
Dec 31,2014
|
Dec 31,2013
|
Dec 31,2012
|
Dec 31,2011
|
||||||
|
Summary Operating Results
|
|
|
||||||||
|
|
Gross revenues
|
$ 1,570,222.60
|
$ 2,309,724.75
|
$ 1,879,132.23
|
$ 946,522.13
|
|
||||
|
Operating expenses
|
$ (977,950.80)
|
$ (1,386,016.28)
|
$ (1,319,317.62)
|
$ (647,618.87)
|
|
|||||
|
|
Opearing income (loss)
|
$ 592,271.80
|
$ 923,708.47
|
$ 559,814.61
|
$ 298,903.26
|
|
||||
|
Interest expense
|
$ (308,865.21)
|
$ (469,321.11)
|
$ (271,433.00)
|
$ (270,883.56)
|
|
|||||
|
|
Net income (loss) - GAAP basis
|
$ 5,266,367.33
|
$ 290,059.72
|
$ (365,983.98)
|
$ (176,783.96)
|
|
||||
|
Summary Statement of Cash Flows
|
|
|
|
|
|
|||||
|
|
Net cash flows provided by (used in) operating activities
|
$ (1,070,661.08)
|
$ 114,361.09
|
$ 945,132.16
|
$ 1,341,515.62
|
|
||||
|
Net cash flows provided by (used in) investing activities
|
$ 1,070,661.08
|
$ (31,472.29)
|
$ (817,502.51)
|
$ (821,562.75)
|
|
|||||
|
|
Net cash flows provided by (used in) financing activities
|
$ -
|
|
$ -
|
$ -
|
|
||||
|
Amount and Source Distributions
|
|
|
|
|
|
|||||
|
|
Total distributions paid to common stockholders
|
$ -
|
$ 45,000.00
|
$ -
|
$ -
|
|
||||
|
Distribution data per $1,000 invested:
|
|
|
|
|
|
|||||
|
|
Total distributions paid to common stockholders
|
-
|
45.00
|
-
|
-
|
|
||||
|
From operations and sales of properties
|
-
|
45.00
|
-
|
-
|
|
|||||
|
|
|
From all other sources (financing or offering proceeds)
|
-
|
-
|
-
|
-
|
|
|||
|
Summary Balance Sheet
|
|
|
|
|
|
|||||
|
|
Total assets (before depreciation)
|
$ -
|
$ 12,432,553.04
|
$ 12,258,652.73
|
$ 12,931,570.55
|
|
||||
|
Total assets (after depreciation)
|
$ -
|
$ 12,021,850.04
|
$ 11,847,949.73
|
$ 12,792,300.55
|
|
|||||
|
|
Total liabilities
|
$ -
|
$ 8,141,624.31
|
$ 8,232,783.71
|
$ 8,811,109.15
|
|
||||
|
Estimated per share value
|
N/A
|
N/A
|
N/A
|
N/A
|
|
|||||
Page | 109
|
Saddlewood
|
||||||||||
|
Project 20
|
||||||||||
|
Period from
Mar 28, 2012 |
|
|||||||||
|
|
(Date of Inception) to
|
|
||||||||
|
Year Ended
|
Year Ended
|
Year Ended
|
Year Ended
|
Year Ended
|
||||||
|
Dec 31,2015
|
Dec 31,2014
|
Dec 31,2013
|
Dec 31,2012
|
Dec 31,2011
|
||||||
|
Summary Operating Results
|
|
|
||||||||
|
|
Gross revenues
|
$ 792,834.44
|
$ 2,546,582.53
|
$ 2,421,622.26
|
$ 1,630,194.52
|
|
||||
|
Operating expenses
|
$ (451,344.82)
|
$ (1,351,800.54)
|
$ (1,318,947.34)
|
$ (949,055.59)
|
|
|||||
|
|
Opearing income (loss)
|
$ 341,489.62
|
$ 1,194,781.99
|
$ 1,102,674.92
|
$ 681,138.93
|
|
||||
|
Interest expense
|
$ (171,605.36)
|
$ (525,124.42)
|
$ (379,595.81)
|
$ (289,539.98)
|
|
|||||
|
|
Net income (loss) - GAAP basis
|
$ 86,367.62
|
$ 291,605.04
|
$ 395,133.15
|
$ 148,836.97
|
|
||||
|
Summary Statement of Cash Flows
|
|
|
|
|
|
|||||
|
|
Net cash flows provided by (used in) operating activities
|
$ (37,673.19)
|
$ 322,329.26
|
$ 562,184.27
|
$ 316,847.57
|
|
||||
|
Net cash flows provided by (used in) investing activities
|
$ -
|
$ (93,186.25)
|
$ 2,401,401.98
|
$ 5,675.62
|
|
|||||
|
|
Net cash flows provided by (used in) financing activities
|
$ -
|
$ -
|
$ -
|
$ -
|
|
||||
|
Amount and Source Distributions
|
|
|
|
|
|
|||||
|
|
Total distributions paid to common stockholders
|
$ 180,000.00
|
$ 3,147,882.95
|
$ 745,000.00
|
$ 178,000.00
|
|
||||
|
Distribution data per $1,000 invested:
|
|
|
|
|
|
|||||
|
|
Total distributions paid to common stockholders
|
180.00
|
3,147.88
|
745.00
|
178.00
|
|
||||
|
From operations and sales of properties
|
180.00
|
735.00
|
745.00
|
178.00
|
|
|||||
|
|
|
From all other sources (financing or offering proceeds)
|
-
|
2,412.88
|
-
|
-
|
|
|||
|
Summary Balance Sheet
|
|
|
|
|
|
|||||
|
|
Total assets (before depreciation)
|
$ 10,698,033.10
|
$ 11,028,876.96
|
$ 13,939,063.64
|
$ 11,328,789.36
|
|
||||
|
Total assets (after depreciation)
|
$ 9,934,195.10
|
$ 10,265,038.96
|
$ 13,430,218.68
|
$ 11,120,930.36
|
|
|||||
|
|
Total liabilities
|
$ 10,644,154.57
|
$ 10,881,366.05
|
$ 10,956,748.56
|
$ 8,297,593.39
|
|
||||
|
Estimated per share value
|
N/A
|
N/A
|
N/A
|
N/A
|
|
|||||
Page | 110
|
Park Vista
|
||||||||||
|
Project 21
|
||||||||||
|
|
Period from
Mar 23, 2012 |
|
||||||||
|
|
(Date of Inception) to
|
|
||||||||
|
Year Ended
|
Year Ended
|
Year Ended
|
Year Ended
|
Year Ended
|
||||||
|
Dec 31,2015
|
Dec 31,2014
|
Dec 31,2013
|
Dec 31,2012
|
Dec 31,2011
|
||||||
|
Summary Operating Results
|
|
|
||||||||
|
|
Gross revenues
|
$ 884,528.06
|
$ 1,056,044.07
|
$ 966,127.56
|
$ 645,997.04
|
|
||||
|
Operating expenses
|
$ (480,738.51)
|
$ (641,899.66)
|
$ (609,500.97)
|
$ (471,094.43)
|
|
|||||
|
|
Opearing income (loss)
|
$ 403,789.55
|
$ 414,144.41
|
$ 356,626.59
|
$ 174,902.61
|
|
||||
|
Interest expense
|
$ (102,861.90)
|
$ (113,694.99)
|
$ (64,833.64)
|
$ -
|
|
|||||
|
|
Net income (loss) - GAAP basis
|
$ 7,130,798.47
|
$ 201,612.46
|
$ 61,429.41
|
$ 29,447.18
|
|
||||
|
Summary Statement of Cash Flows
|
|
|
|
|
|
|||||
|
|
Net cash flows provided by (used in) operating activities
|
$ (51,485.61)
|
$ 51,680.24
|
$ 524,966.54
|
$ 1,130,160.69
|
|
||||
|
Net cash flows provided by (used in) investing activities
|
$ 51,485.61
|
$ (10,156.67)
|
$ (375,927.94)
|
$ (970,222.57)
|
|
|||||
|
|
Net cash flows provided by (used in) financing activities
|
$ -
|
$ -
|
$ -
|
$ -
|
|
||||
|
Amount and Source Distributions
|
|
|
|
|
|
|||||
|
|
Total distributions paid to common stockholders
|
$ -
|
$ 73,000.00
|
$ 70,000.00
|
$ 45,000.00
|
|
||||
|
Distribution data per $1,000 invested:
|
|
|
|
|
|
|||||
|
|
Total distributions paid to common stockholders
|
-
|
73.00
|
70.00
|
45.00
|
|
||||
|
From operations and sales of properties
|
-
|
73.00
|
70.00
|
45.00
|
|
|||||
|
|
|
From all other sources (financing or offering proceeds)
|
-
|
-
|
-
|
-
|
|
|||
|
Summary Balance Sheet
|
|
|
|
|
|
|||||
|
|
Total assets (before depreciation)
|
$ 5,820,684.19
|
$ 5,746,703.31
|
$ 5,705,794.09
|
$ 5,233,451.17
|
|
||||
|
Total assets (after depreciation)
|
$ 5,417,894.19
|
$ 5,504,315.31
|
$ 5,463,406.09
|
$ 5,138,381.17
|
|
|||||
|
|
Total liabilities
|
$ 20,018.27
|
$ 3,547,966.46
|
$ 3,615,669.69
|
$ 63,934.00
|
|
||||
|
Estimated per share value
|
N/A
|
N/A
|
N/A
|
N/A
|
|
|||||
Page | 111
|
BeachOak
|
||||||||||
|
Project 22
|
||||||||||
|
|
Period from
Mar 26, 2012 |
|
||||||||
|
|
(Date of Inception) to
|
|
||||||||
|
Year Ended
|
Year Ended
|
Year Ended
|
Year Ended
|
Year Ended
|
||||||
|
Dec 31,2015
|
Dec 31,2014
|
Dec 31,2013
|
Dec 31,2012
|
Dec 31,2011
|
||||||
|
Summary Operating Results
|
|
|
||||||||
|
|
Gross revenues
|
$ 1,224,148.71
|
$ 3,175,522.79
|
$ 2,963,909.96
|
$ 1,850,231.73
|
|
||||
|
Operating expenses
|
$ (624,371.96)
|
$ (1,783,845.28)
|
$ (1,769,318.27)
|
$ (1,369,270.74)
|
|
|||||
|
|
Opearing income (loss)
|
$ 599,776.75
|
$ 1,391,677.51
|
$ 1,194,591.69
|
$ 480,960.99
|
|
||||
|
Interest expense
|
$ (223,507.44)
|
$ (683,213.69)
|
$ (689,348.29)
|
$ (546,106.23)
|
|
|||||
|
|
Net income (loss) - GAAP basis
|
$ 261,015.78
|
$ 91,690.75
|
$ (126,262.07)
|
$ (498,451.61)
|
|
||||
|
Summary Statement of Cash Flows
|
|
|
|
|
|
|||||
|
|
Net cash flows provided by (used in) operating activities
|
$ 499,654.03
|
$ 416,963.41
|
$ 352,684.92
|
$ 546,317.63
|
|
||||
|
Net cash flows provided by (used in) investing activities
|
$ -
|
$ (277,315.81)
|
$ (223,559.19)
|
$ (325,782.09)
|
|
|||||
|
|
Net cash flows provided by (used in) financing activities
|
$ -
|
$ -
|
$ -
|
$ -
|
|
||||
|
Amount and Source Distributions
|
|
|
|
|
|
|||||
|
|
Total distributions paid to common stockholders
|
$ 55,000.00
|
$ 250,000.02
|
$ 185,000.01
|
$ -
|
|
||||
|
Distribution data per $1,000 invested:
|
|
|
|
|
|
|||||
|
|
Total distributions paid to common stockholders
|
55.00
|
250.00
|
185.00
|
-
|
|
||||
|
From operations and sales of properties
|
55.00
|
250.00
|
185.00
|
-
|
|
|||||
|
|
|
From all other sources (financing or offering proceeds)
|
-
|
-
|
-
|
-
|
|
|||
|
Summary Balance Sheet
|
|
|
|
|
|
|||||
|
|
Total assets (before depreciation)
|
$ 17,129,876.91
|
$ 17,016,583.38
|
$ 16,748,665.89
|
$ 16,854,111.37
|
|
||||
|
Total assets (after depreciation)
|
$ 15,717,371.91
|
$ 15,604,078.38
|
$ 15,837,201.89
|
$ 16,488,765.37
|
|
|||||
|
|
Total liabilities
|
$ 11,793,072.55
|
$ 11,892,101.34
|
$ 11,966,915.58
|
$ 12,307,216.98
|
|
||||
|
Estimated per share value
|
N/A
|
N/A
|
N/A
|
N/A
|
|
|||||
Page | 112
|
Cypress
|
||||||||||
|
Project 23
|
||||||||||
|
|
Period from Dec 15, 2011
|
|||||||||
|
|
(Date of Inception) to
|
|||||||||
|
Year Ended
|
Year Ended
|
Year Ended
|
Year Ended
|
Year Ended
|
||||||
|
Dec 31,2015
|
Dec 31,2014
|
Dec 31,2013
|
Dec 31,2012
|
Dec 31,2011
|
||||||
|
Summary Operating Results
|
|
|
||||||||
|
|
Gross revenues
|
$ 1,347,882.29
|
$ 3,831,174.44
|
$ 3,393,885.70
|
$ 2,884,633.34
|
$ 188,569.95
|
||||
|
Operating expenses
|
$ (746,013.25)
|
$ (2,077,273.03)
|
$ (2,102,037.97)
|
$ (2,033,714.01)
|
$ (37,885.85)
|
|||||
|
|
Opearing income (loss)
|
$ 601,869.04
|
$ 1,753,901.41
|
$ 1,291,847.73
|
$ 850,919.33
|
$ 150,684.10
|
||||
|
Interest expense
|
$ (166,686.02)
|
$ (404,413.00)
|
$ (518,751.41)
|
$ (520,172.64)
|
$ (24,161.02)
|
|||||
|
|
Net income (loss) - GAAP basis
|
$ 410,987.06
|
$ 754,924.78
|
$ 291,688.34
|
$ (80,743.19)
|
$ 108,413.30
|
||||
|
Summary Statement of Cash Flows
|
|
|
|
|
|
|||||
|
|
Net cash flows provided by (used in) operating activities
|
$ 1,448,173.98
|
$ 1,424,413.00
|
$ 1,517,826.30
|
$ 1,817,728.84
|
$ 140,706.16
|
||||
|
Net cash flows provided by (used in) investing activities
|
$ (57,231.13)
|
$ (70,661.12)
|
$ (2,964.63)
|
$ (73,870.43)
|
$ (3,366,357.21)
|
|||||
|
|
Net cash flows provided by (used in) financing activities
|
$ (200,000.01)
|
$ -
|
$ -
|
$ -
|
$ 6,275,013.48
|
||||
|
Amount and Source Distributions
|
|
|
|
|
|
|||||
|
|
Total distributions paid to common stockholders
|
$ 310,000.00
|
$ 450,000.00
|
$ 92,000.00
|
$ 356,000.00
|
$ -
|
||||
|
Distribution data per $1,000 invested:
|
|
|
|
|
|
|||||
|
|
Total distributions paid to common stockholders
|
310.00
|
450.00
|
92.00
|
356.00
|
-
|
||||
|
From operations and sales of properties
|
310.00
|
450.00
|
92.00
|
356.00
|
-
|
|||||
|
|
|
From all other sources (financing or offering proceeds)
|
-
|
-
|
-
|
-
|
-
|
|||
|
Summary Balance Sheet
|
|
|
|
|
|
|||||
|
|
Total assets (before depreciation)
|
$ 17,720,056.28
|
$ 17,826,913.88
|
$ 17,568,377.43
|
$ 17,265,343.38
|
$ 16,833,890.73
|
||||
|
Total assets (after depreciation)
|
$ 16,569,839.28
|
$ 16,676,696.88
|
$ 16,822,573.43
|
$ 16,905,985.38
|
$ 16,820,862.73
|
|||||
|
|
Total liabilities
|
$ 10,397,556.37
|
$ 10,605,401.02
|
$ 10,786,202.35
|
$ 10,959,301.79
|
$ 10,437,435.95
|
||||
|
Estimated per share value
|
N/A
|
N/A
|
N/A
|
N/A
|
N/A
|
|||||
Page | 113
|
Parkwood
|
||||||||||
|
Project 24
|
||||||||||
|
|
Period from Oct 18, 2011
|
|||||||||
|
|
(Date of Inception) to
|
|||||||||
|
Year Ended
|
Year Ended
|
Year Ended
|
Year Ended
|
Year Ended
|
||||||
|
Dec 31,2015
|
Dec 31,2014
|
Dec 31,2013
|
Dec 31,2012
|
Dec 31,2011
|
||||||
|
Summary Operating Results
|
|
|
||||||||
|
|
Gross revenues
|
$ 526,599.00
|
$ 1,066,972.31
|
$ 1,075,375.59
|
$ 1,070,158.29
|
$ 199,737.25
|
||||
|
Operating expenses
|
$ (332,479.00)
|
$ (671,919.42)
|
$ (612,170.21)
|
$ (632,286.76)
|
$ (97,156.65)
|
|||||
|
|
Opearing income (loss)
|
$ 194,120.00
|
$ 395,052.89
|
$ 463,205.38
|
$ 437,871.53
|
$ 102,580.60
|
||||
|
Interest expense
|
$ (60,957.00)
|
$ (134,847.16)
|
$ (208,419.46)
|
$ (221,125.02)
|
$ (45,312.55)
|
|||||
|
|
Net income (loss) - GAAP basis
|
$ 2,362,150.00
|
$ 4,634.74
|
$ 20,636.63
|
$ 15,216.34
|
$ 15,846.39
|
||||
|
Summary Statement of Cash Flows
|
|
|
|
|
|
|||||
|
|
Net cash flows provided by (used in) operating activities
|
$ 73,738.88
|
$ 235,241.85
|
$ 278,928.64
|
$ 518,135.29
|
$ 301,325.05
|
||||
|
Net cash flows provided by (used in) investing activities
|
$ -
|
$ (184,768.16)
|
$ (170,294.25)
|
$ (454,006.97)
|
$ (154,701.11)
|
|||||
|
|
Net cash flows provided by (used in) financing activities
|
$ -
|
$ -
|
$ -
|
$ -
|
$ (15,000.00)
|
||||
|
Amount and Source Distributions
|
|
|
|
|
|
|||||
|
|
Total distributions paid to common stockholders
|
$ 55,000.00
|
$ 119,000.00
|
$ 257,000.01
|
$ 75,000.00
|
$ -
|
||||
|
Distribution data per $1,000 invested:
|
|
|
|
|
|
|||||
|
|
Total distributions paid to common stockholders
|
55.00
|
119.00
|
257.00
|
75.00
|
-
|
||||
|
From operations and sales of properties
|
55.00
|
119.00
|
57.00
|
75.00
|
-
|
|||||
|
|
|
From all other sources (financing or offering proceeds)
|
-
|
-
|
200.00
|
-
|
-
|
|||
|
Summary Balance Sheet
|
|
|
|
|
|
|||||
|
|
Total assets (before depreciation)
|
$ 4,764,563.81
|
$ 5,750,708.17
|
$ 5,698,323.33
|
$ 5,883,740.01
|
$ 5,919,350.53
|
||||
|
Total assets (after depreciation)
|
$ 4,616,339.35
|
$ 5,222,294.17
|
$ 5,343,751.33
|
$ 5,696,533.01
|
$ 5,888,597.53
|
|||||
|
|
Total liabilities
|
$ -
|
$ 2,816,258.98
|
$ 2,818,230.88
|
$ 2,933,390.17
|
$ 3,050,799.60
|
||||
|
Estimated per share value
|
N/A
|
N/A
|
N/A
|
N/A
|
N/A
|
|||||
Page | 114
|
Sun Bay
|
||||||||||
|
Project 25
|
||||||||||
|
|
Period from Oct 7, 2011
|
|||||||||
|
|
(Date of Inception) to
|
|||||||||
|
Year Ended
|
Year Ended
|
Year Ended
|
Year Ended
|
Year Ended
|
||||||
|
Dec 31,2015
|
Dec 31,2014
|
Dec 31,2013
|
Dec 31,2012
|
Dec 31,2011
|
||||||
|
Summary Operating Results
|
|
|
||||||||
|
|
Gross revenues
|
$ 535,965.89
|
$ 1,389,799.46
|
$ 1,370,953.59
|
$ 1,290,397.00
|
$ 280,075.93
|
||||
|
Operating expenses
|
$ (328,278.72)
|
$ (899,701.28)
|
$ (875,462.57)
|
$ (1,004,170.33)
|
$ (174,703.95)
|
|||||
|
|
Opearing income (loss)
|
$ 207,687.17
|
$ 490,098.18
|
$ 495,491.02
|
$ 286,226.67
|
$ 105,371.98
|
||||
|
Interest expense
|
$ (191,419.79)
|
$ (429,292.98)
|
$ (211,205.00)
|
$ (471,287.58)
|
$ (110,739.71)
|
|||||
|
|
Net income (loss) - GAAP basis
|
$ 2,311,797.80
|
$ (232,029.26)
|
$ (289,441.21)
|
$ (433,779.89)
|
$ (73,207.74)
|
||||
|
Summary Statement of Cash Flows
|
|
|
|
|
|
|||||
|
|
Net cash flows provided by (used in) operating activities
|
$ -
|
$ 212,451.44
|
$ 105,801.46
|
$ 142,930.22
|
$ 619,981.08
|
||||
|
Net cash flows provided by (used in) investing activities
|
$ -
|
$ (2,801.57)
|
$ (78,092.98)
|
$ -
|
$ (2,475,063.23)
|
|||||
|
|
Net cash flows provided by (used in) financing activities
|
$ -
|
$ -
|
$ -
|
$ -
|
$ 1,998,012.37
|
||||
|
Amount and Source Distributions
|
|
|
|
|
|
|||||
|
|
Total distributions paid to common stockholders
|
$ -
|
$ 758,124.00
|
$ -
|
$ 22,500.00
|
$ -
|
||||
|
Distribution data per $1,000 invested:
|
|
|
|
|
|
|||||
|
|
Total distributions paid to common stockholders
|
-
|
758.12
|
-
|
22.50
|
-
|
||||
|
From operations and sales of properties
|
-
|
-
|
-
|
22.50
|
-
|
|||||
|
|
|
From all other sources (financing or offering proceeds)
|
-
|
758.12
|
-
|
-
|
-
|
|||
|
Summary Balance Sheet
|
|
|
|
|
|
|||||
|
|
Total assets (before depreciation)
|
$ -
|
$ 7,747,118.55
|
$ 7,291,155.26
|
$ 6,848,433.70
|
$ 7,359,740.31
|
||||
|
Total assets (after depreciation)
|
$ -
|
$ 7,120,208.55
|
$ 6,868,798.26
|
$ 7,059,585.70
|
$ 7,319,187.31
|
|||||
|
|
Total liabilities
|
$ -
|
$ 6,174,395.12
|
$ 5,160,227.10
|
$ 5,061,573.33
|
$ 4,862,395.05
|
||||
|
Estimated per share value
|
N/A
|
N/A
|
N/A
|
N/A
|
N/A
|
|||||
Page | 115
|
Eastport
|
||||||||||
|
Project 26
|
||||||||||
|
|
Period from Sep 29, 2011
|
|||||||||
|
|
(Date of Inception) to
|
|||||||||
|
Year Ended
|
Year Ended
|
Year Ended
|
Year Ended
|
Year Ended
|
||||||
|
Dec 31,2015
|
Dec 31,2014
|
Dec 31,2013
|
Dec 31,2012
|
Dec 31,2011
|
||||||
|
Summary Operating Results
|
|
|
||||||||
|
|
Gross revenues
|
$ 1,555,231.66
|
$ 4,352,571.03
|
$ 4,377,701.46
|
$ 4,286,610.88
|
$ 1,035,727.08
|
||||
|
Operating expenses
|
$ (734,435.25)
|
$ (2,198,216.90)
|
$ (2,149,945.62)
|
$ (2,101,651.52)
|
$ (473,852.64)
|
|||||
|
|
Opearing income (loss)
|
$ 820,796.41
|
$ 2,154,354.13
|
$ 2,227,755.84
|
$ 2,184,959.36
|
$ 561,874.44
|
||||
|
Interest expense
|
$ (412,087.59)
|
$ (1,265,068.84)
|
$ (1,269,682.89)
|
$ (1,273,161.48)
|
$ (326,986.83)
|
|||||
|
|
Net income (loss) - GAAP basis
|
$ 240,981.60
|
$ (429,095.97)
|
$ (306,431.56)
|
$ (330,477.30)
|
$ (122,646.80)
|
||||
|
Summary Statement of Cash Flows
|
|
|
|
|
|
|||||
|
|
Net cash flows provided by (used in) operating activities
|
$ (15,828.54)
|
$ 340,184.51
|
$ 688,603.11
|
$ 565,696.95
|
$ 1,207,763.18
|
||||
|
Net cash flows provided by (used in) investing activities
|
$ -
|
$ (267,749.70)
|
$ (313,789.18)
|
$ (114,233.40)
|
$ (165,521.28)
|
|||||
|
|
Net cash flows provided by (used in) financing activities
|
$ -
|
$ -
|
$ 2,200.63
|
$ -
|
$ -
|
||||
|
Amount and Source Distributions
|
|
|
|
|
|
|||||
|
|
Total distributions paid to common stockholders
|
$ -
|
$ 170,000.00
|
$ 518,000.00
|
$ 600,000.00
|
$ 732,400.00
|
||||
|
Distribution data per $1,000 invested:
|
|
|
|
|
|
|||||
|
|
Total distributions paid to common stockholders
|
-
|
170.00
|
518.00
|
600.00
|
732.40
|
||||
|
From operations and sales of properties
|
-
|
170.00
|
518.00
|
600.00
|
732.40
|
|||||
|
|
|
From all other sources (financing or offering proceeds)
|
-
|
-
|
-
|
-
|
-
|
|||
|
Summary Balance Sheet
|
|
|
|
|
|
|||||
|
|
Total assets (before depreciation)
|
$ 36,762,783.95
|
$ 36,714,658.89
|
$ 36,652,000.05
|
$ 36,344,614.65
|
$ 36,223,267.40
|
||||
|
Total assets (after depreciation)
|
$ 32,664,910.74
|
$ 32,767,047.89
|
$ 33,920,146.05
|
$ 34,825,080.65
|
$ 35,886,444.40
|
|||||
|
|
Total liabilities
|
$ 26,283,338.34
|
$ 26,420,099.52
|
$ 26,626,101.71
|
$ 26,624,604.75
|
$ 26,364,000.00
|
||||
|
Estimated per share value
|
N/A
|
N/A
|
N/A
|
N/A
|
N/A
|
|||||
Page | 116
|
Cove Biloxi
|
||||||||||
|
Project 27
|
||||||||||
|
|
Period from Sep 6, 2011
|
|||||||||
|
|
(Date of Inception) to
|
|||||||||
|
Year Ended
|
Year Ended
|
Year Ended
|
Year Ended
|
Year Ended
|
||||||
|
Dec 31,2015
|
Dec 31,2014
|
Dec 31,2013
|
Dec 31,2012
|
Dec 31,2011
|
||||||
|
Summary Operating Results
|
|
|
||||||||
|
|
Gross revenues
|
$ 1,243,177.13
|
$ 1,197,824.63
|
$ 1,208,355.43
|
$ 1,114,856.59
|
$ 348,515.32
|
||||
|
Operating expenses
|
$ (663,557.04)
|
$ (665,380.99)
|
$ (649,411.11)
|
$ (655,465.00)
|
$ (206,097.65)
|
|||||
|
|
Opearing income (loss)
|
$ 579,620.09
|
$ 532,443.64
|
$ 558,944.32
|
$ 459,391.59
|
$ 142,417.67
|
||||
|
Interest expense
|
$ (241,451.54)
|
$ 245,252.51
|
$ (313,130.78)
|
$ (407,328.75)
|
$ (126,215.75)
|
|||||
|
|
Net income (loss) - GAAP basis
|
$ 279,075.33
|
$ 52,417.38
|
$ (30,307.74)
|
$ (179,810.12)
|
$ (22,702.17)
|
||||
|
Summary Statement of Cash Flows
|
|
|
|
|
|
|||||
|
|
Net cash flows provided by (used in) operating activities
|
$ 263,803.46
|
$ 262,490.55
|
$ 369,451.45
|
$ 698,305.37
|
$ 1,146,807.59
|
||||
|
Net cash flows provided by (used in) investing activities
|
$ (13,507.91)
|
$ (6,112.68)
|
$ 21,779.24
|
$ 7,135.07
|
$ (10,063.91)
|
|||||
|
|
Net cash flows provided by (used in) financing activities
|
$ -
|
$ -
|
$ -
|
$ -
|
$ -
|
||||
|
Amount and Source Distributions
|
|
|
|
|
|
|||||
|
|
Total distributions paid to common stockholders
|
$ -
|
$ 99,000.00
|
$ 1,391,495.18
|
$ 160,000.00
|
$ -
|
||||
|
Distribution data per $1,000 invested:
|
|
|
|
|
|
|||||
|
|
Total distributions paid to common stockholders
|
-
|
99.00
|
1,391.50
|
160.00
|
-
|
||||
|
From operations and sales of properties
|
-
|
99.00
|
147.00
|
160.00
|
-
|
|||||
|
|
|
From all other sources (financing or offering proceeds)
|
-
|
-
|
1,244.50
|
-
|
-
|
|||
|
Summary Balance Sheet
|
|
|
|
|
|
|||||
|
|
Total assets (before depreciation)
|
$ 6,279,869.96
|
$ 5,934,322.51
|
$ 5,847,958.00
|
$ 5,801,426.32
|
$ 5,967,189.71
|
||||
|
Total assets (after depreciation)
|
$ 5,603,331.56
|
$ 5,398,139.51
|
$ 5,484,456.00
|
$ 5,602,497.32
|
$ 5,923,684.71
|
|||||
|
|
Total liabilities
|
$ 5,120,154.06
|
$ 5,179,037.34
|
$ 5,218,771.21
|
$ 3,915,009.61
|
$ 3,896,386.88
|
||||
|
Estimated per share value
|
N/A
|
N/A
|
N/A
|
N/A
|
N/A
|
|||||
Page | 117
|
Enclave
|
||||||||||
|
Project 28
|
||||||||||
|
|
Period from Jun 23, 2011
|
|||||||||
|
|
(Date of Inception) to
|
|||||||||
|
Year Ended
|
Year Ended
|
Year Ended
|
Year Ended
|
Year Ended
|
||||||
|
Dec 31,2015
|
Dec 31,2014
|
Dec 31,2013
|
Dec 31,2012
|
Dec 31,2011
|
||||||
|
Summary Operating Results
|
|
|
||||||||
|
|
Gross revenues
|
|
|
$ 3,647,743.44
|
$ 3,046,856.70
|
$ 1,202,580.54
|
||||
|
Operating expenses
|
|
$ 1,110,786.78
|
$ (2,077,885.33)
|
$ (1,078,056.51)
|
$ (931,634.32)
|
|||||
|
|
Opearing income (loss)
|
|
$ (554,837.45)
|
$ 1,569,858.11
|
$ 1,968,800.19
|
$ 270,946.22
|
||||
|
Interest expense
|
|
$ 555,949.33
|
$ (499,033.36)
|
$ (473,635.15)
|
$ (524,768.72)
|
|||||
|
|
Net income (loss) - GAAP basis
|
|
$ 6,654,300.89
|
$ 1,569,858.11
|
$ (165,440.48)
|
$ (692,626.46)
|
||||
|
Summary Statement of Cash Flows
|
|
|
|
|
|
|||||
|
|
Net cash flows provided by (used in) operating activities
|
|
$ 1,966,696.33
|
$ 1,010,493.52
|
$ 734,023.37
|
$ 369,235.72
|
||||
|
Net cash flows provided by (used in) investing activities
|
|
$ (161,473.15)
|
$ (21,253.98)
|
$ (44,494.51)
|
$ 322,194.00
|
|||||
|
|
Net cash flows provided by (used in) financing activities
|
|
$ -
|
$ -
|
$ -
|
$ -
|
||||
|
Amount and Source Distributions
|
|
|
|
|
|
|||||
|
|
Total distributions paid to common stockholders
|
|
$ 632,000.00
|
$ 228,000.00
|
$ 411,750.00
|
$ -
|
||||
|
Distribution data per $1,000 invested:
|
|
|
|
|
|
|||||
|
|
Total distributions paid to common stockholders
|
|
632.00
|
228.00
|
411.75
|
-
|
||||
|
From operations and sales of properties
|
|
632.00
|
228.00
|
411.75
|
-
|
|||||
|
|
|
From all other sources (financing or offering proceeds)
|
|
-
|
-
|
-
|
-
|
|||
|
Summary Balance Sheet
|
|
|
|
|
|
|||||
|
|
Total assets (before depreciation)
|
|
$ -
|
$ 24,161,135.73
|
$ 23,652,220.69
|
$ 22,103,088.51
|
||||
|
Total assets (after depreciation)
|
|
$ -
|
$ 22,836,876.73
|
$ 22,874,384.69
|
$ 21,841,745.51
|
|||||
|
|
Total liabilities
|
|
$ -
|
$ 14,789,756.65
|
$ 14,524,679.77
|
$ 12,708,850.11
|
||||
|
Estimated per share value
|
|
N/A
|
N/A
|
N/A
|
N/A
|
|||||
Page | 118
|
Hunters Way
|
||||||||||
|
Project 29
|
||||||||||
|
|
Period from May 20, 2011
|
|||||||||
|
|
(Date of Inception) to
|
|||||||||
|
Year Ended
|
Year Ended
|
Year Ended
|
Year Ended
|
Year Ended
|
||||||
|
Dec 31,2015
|
Dec 31,2014
|
Dec 31,2013
|
Dec 31,2012
|
Dec 31,2011
|
||||||
|
Summary Operating Results
|
|
|
||||||||
|
|
Gross revenues
|
$ 672,015.69
|
$ 1,935,710.09
|
$ 1,986,841.67
|
$ 1,932,289.47
|
$ 1,178,433.39
|
||||
|
Operating expenses
|
$ (375,482.96)
|
$ (1,060,780.48)
|
$ (965,563.54)
|
$ (925,831.30)
|
$ (479,283.33)
|
|||||
|
|
Opearing income (loss)
|
$ 296,532.73
|
$ 874,929.61
|
$ 1,021,278.13
|
$ 1,006,458.17
|
$ 699,150.06
|
||||
|
Interest expense
|
$ (124,576.57)
|
$ (509,648.06)
|
$ (516,227.65)
|
$ (524,013.02)
|
$ (323,971.00)
|
|||||
|
|
Net income (loss) - GAAP basis
|
$ 57,348.19
|
$ (107,229.72)
|
$ 16,048.93
|
$ (88,174.71)
|
$ 98,100.26
|
||||
|
Summary Statement of Cash Flows
|
|
|
|
|
|
|||||
|
|
Net cash flows provided by (used in) operating activities
|
$ 7,575.10
|
$ 222,927.19
|
$ 258,780.92
|
$ 243,199.10
|
$ 341,438.37
|
||||
|
Net cash flows provided by (used in) investing activities
|
|
$ (171,148.24)
|
$ (153,191.09)
|
$ (104,307.39)
|
$ (87,415.44)
|
|||||
|
|
Net cash flows provided by (used in) financing activities
|
|
|
|
$ -
|
$ -
|
||||
|
Amount and Source Distributions
|
|
|
|
|
|
|||||
|
|
Total distributions paid to common stockholders
|
$ -
|
$ 60,000.00
|
$ 270,000.00
|
$ 323,000.00
|
$ 150,000.00
|
||||
|
Distribution data per $1,000 invested:
|
|
|
|
|
|
|||||
|
|
Total distributions paid to common stockholders
|
-
|
60.00
|
270.00
|
323.00
|
150.00
|
||||
|
From operations and sales of properties
|
-
|
60.00
|
270.00
|
323.00
|
150.00
|
|||||
|
|
|
From all other sources (financing or offering proceeds)
|
-
|
-
|
-
|
-
|
-
|
|||
|
Summary Balance Sheet
|
|
|
|
|
|
|||||
|
|
Total assets (before depreciation)
|
$ 13,735,624.06
|
$ 13,732,236.49
|
$ 13,560,211.66
|
$ 13,461,298.99
|
$ 13,391,393.27
|
||||
|
Total assets (after depreciation)
|
$ 12,033,140.39
|
$ 12,050,602.49
|
$ 12,298,589.66
|
$ 12,674,409.99
|
$ 13,156,059.27
|
|||||
|
|
Total liabilities
|
$ 8,960,047.44
|
$ 8,984,857.73
|
$ 9,065,615.18
|
$ 9,187,484.44
|
$ 9,257,959.01
|
||||
|
Estimated per share value
|
N/A
|
N/A
|
N/A
|
N/A
|
N/A
|
|||||
Page | 119
|
Arville
|
||||||||||
|
Project 30
|
||||||||||
|
|
Period from May 5, 2011
|
|||||||||
|
|
(Date of Inception) to
|
|||||||||
|
Year Ended
|
Year Ended
|
Year Ended
|
Year Ended
|
Year Ended
|
||||||
|
Dec 31,2015
|
Dec 31,2014
|
Dec 31,2013
|
Dec 31,2012
|
Dec 31,2011
|
||||||
|
Summary Operating Results
|
|
|
||||||||
|
|
Gross revenues
|
$ 774,995.61
|
$ 1,092,196.07
|
$ 1,060,372.81
|
$ 1,053,167.31
|
$ 683,991.62
|
||||
|
Operating expenses
|
$ (436,548.20)
|
$ (588,903.53)
|
$ (561,096.18)
|
$ (624,120.73)
|
$ (358,516.51)
|
|||||
|
|
Opearing income (loss)
|
$ 338,447.41
|
$ 503,292.54
|
$ 499,276.63
|
$ 429,046.58
|
$ 325,475.11
|
||||
|
Interest expense
|
$ (254,051.90)
|
$ (281,988.77)
|
$ (285,549.22)
|
$ (228,466.08)
|
$ -
|
|||||
|
|
Net income (loss) - GAAP basis
|
$ 1,829,548.91
|
$ (1,215.62)
|
$ (1,158.52)
|
$ 15,098.56
|
$ 136,190.38
|
||||
|
Summary Statement of Cash Flows
|
|
|
|
|
|
|||||
|
|
Net cash flows provided by (used in) operating activities
|
$ -
|
$ 150,420.49
|
$ 224,551.39
|
$ 392,580.09
|
$ 1,121,472.66
|
||||
|
Net cash flows provided by (used in) investing activities
|
$ -
|
$ (104,888.52)
|
$ (125,383.68)
|
$ (259,935.12)
|
$ (211,896.56)
|
|||||
|
|
Net cash flows provided by (used in) financing activities
|
$ -
|
$ -
|
$ -
|
$ -
|
$ -
|
||||
|
Amount and Source Distributions
|
|
|
|
|
|
|||||
|
|
Total distributions paid to common stockholders
|
$ -
|
$ 112,000.00
|
$ 142,000.00
|
$ 4,893,437.97
|
$ 235,000.00
|
||||
|
Distribution data per $1,000 invested:
|
|
|
|
|
|
|||||
|
|
Total distributions paid to common stockholders
|
-
|
112.00
|
142.00
|
4,893.44
|
235.00
|
||||
|
From operations and sales of properties
|
-
|
112.00
|
142.00
|
100.00
|
235.00
|
|||||
|
|
|
From all other sources (financing or offering proceeds)
|
-
|
-
|
-
|
4,793.44
|
-
|
|||
|
Summary Balance Sheet
|
|
|
|
|
|
|||||
|
|
Total assets (before depreciation)
|
$ -
|
$ 5,455,232.48
|
$ 5,467,509.27
|
$ 5,537,577.32
|
$ 5,685,995.16
|
||||
|
Total assets (after depreciation)
|
$ -
|
$ 4,984,095.48
|
$ 5,132,605.27
|
$ 5,333,325.32
|
$ 5,588,107.16
|
|||||
|
|
Total liabilities
|
$ -
|
$ 4,682,087.71
|
$ 4,706,372.72
|
$ 4,778,345.75
|
$ 31,916.78
|
||||
|
Estimated per share value
|
N/A
|
N/A
|
N/A
|
N/A
|
N/A
|
|||||
Page | 120
|
Bedford 2
|
||||||||||
|
Project 31
|
||||||||||
|
|
Period from Jan 12, 2011
|
|||||||||
|
|
(Date of Inception) to
|
|||||||||
|
Year Ended
|
Year Ended
|
Year Ended
|
Year Ended
|
Year Ended
|
||||||
|
Dec 31,2015
|
Dec 31,2014
|
Dec 31,2013
|
Dec 31,2012
|
Dec 31,2011
|
||||||
|
Summary Operating Results
|
|
|
||||||||
|
|
Gross revenues
|
$ 1,563,384.50
|
$ 4,478,755.46
|
$ 4,145,830.55
|
$ 3,870,614.76
|
$ 3,329,047.49
|
||||
|
Operating expenses
|
$ (781,257.72)
|
$ (2,316,839.41)
|
$ (2,315,461.55)
|
$ (2,256,786.23)
|
$ (2,035,907.61)
|
|||||
|
|
Opearing income (loss)
|
$ 782,126.78
|
$ 2,161,916.05
|
$ 1,830,369.00
|
$ 1,613,828.53
|
$ 1,293,139.88
|
||||
|
Interest expense
|
$ (262,190.74)
|
$ (806,319.04)
|
$ (752,246.66)
|
$ (779,291.47)
|
$ (748,556.44)
|
|||||
|
|
Net income (loss) - GAAP basis
|
$ 466,592.89
|
$ 625,507.60
|
$ 379,600.82
|
$ (12,754.90)
|
$ (251,330.24)
|
||||
|
Summary Statement of Cash Flows
|
|
|
|
|
|
|||||
|
|
Net cash flows provided by (used in) operating activities
|
$ 975,039.59
|
$ 993,164.19
|
$ 1,364,128.23
|
$ 1,577,598.60
|
$ 1,195,515.94
|
||||
|
Net cash flows provided by (used in) investing activities
|
$ (69,797.27)
|
$ (6,645.72)
|
$ 1,041,453.56
|
$ (20,193.37)
|
$ (103,540.96)
|
|||||
|
|
Net cash flows provided by (used in) financing activities
|
$ (140,000.00)
|
$ -
|
$ -
|
$ -
|
$ -
|
||||
|
Amount and Source Distributions
|
|
|
|
|
|
|||||
|
|
Total distributions paid to common stockholders
|
$ 295,000.00
|
$ 2,109,692.67
|
$ 500,000.00
|
$ 4,685,000.00
|
$ 515,440.00
|
||||
|
Distribution data per $1,000 invested:
|
|
|
|
|
|
|||||
|
|
Total distributions paid to common stockholders
|
295.00
|
2,109.69
|
500.00
|
4,685.00
|
515.44
|
||||
|
From operations and sales of properties
|
295.00
|
1,032.83
|
500.00
|
375.00
|
515.44
|
|||||
|
|
|
From all other sources (financing or offering proceeds)
|
-
|
1,076.86
|
-
|
4,310.00
|
-
|
|||
|
Summary Balance Sheet
|
|
|
|
|
|
|||||
|
|
Total assets (before depreciation)
|
$ 19,179,817.22
|
$ 19,331,638.47
|
$ 20,440,523.89
|
$ 18,998,915.61
|
$ 17,314,901.85
|
||||
|
Total assets (after depreciation)
|
$ 16,684,809.89
|
$ 16,857,778.50
|
$ 18,569,988.92
|
$ 17,705,865.28
|
$ 16,667,299.14
|
|||||
|
|
Total liabilities
|
$ 16,996,495.60
|
$ 17,341,057.10
|
$ 17,564,913.24
|
$ 16,580,390.42
|
$ 10,844,069.38
|
||||
|
Estimated per share value
|
N/A
|
N/A
|
N/A
|
N/A
|
N/A
|
|||||
Page | 121
|
Stonebridge
|
||||||||||
|
Project 32
|
||||||||||
|
|
Period from Jan 5, 2011
|
|||||||||
|
|
(Date of Inception) to
|
|||||||||
|
Year Ended
|
Year Ended
|
Year Ended
|
Year Ended
|
Year Ended
|
||||||
|
Dec 31,2015
|
Dec 31,2014
|
Dec 31,2013
|
Dec 31,2012
|
Dec 31,2011
|
||||||
|
Summary Operating Results
|
|
|
||||||||
|
|
Gross revenues
|
$ 936,639.87
|
$ 2,662,355.68
|
$ 2,510,324.18
|
$ 2,377,283.94
|
$ 2,355,223.19
|
||||
|
Operating expenses
|
$ (376,159.41)
|
$ (1,056,907.12)
|
$ (1,194,363.00)
|
$ (1,039,586.23)
|
$ (1,912,940.92)
|
|||||
|
|
Opearing income (loss)
|
$ 560,480.46
|
$ 1,605,448.56
|
$ 1,315,961.18
|
$ 1,337,697.71
|
$ 442,282.27
|
||||
|
Interest expense
|
$ (219,803.43)
|
$ (498,236.00)
|
$ (609,736.75)
|
$ (632,161.06)
|
$ (603,568.33)
|
|||||
|
|
Net income (loss) - GAAP basis
|
$ 291,591.51
|
$ 363,751.07
|
$ 217,376.52
|
$ (83,405.46)
|
$ (83,272.65)
|
||||
|
Summary Statement of Cash Flows
|
|
|
|
|
|
|||||
|
|
Net cash flows provided by (used in) operating activities
|
$ 201,631.73
|
$ 778,831.72
|
$ 716,321.27
|
$ 1,218,000.16
|
$ 298,170.41
|
||||
|
Net cash flows provided by (used in) investing activities
|
$ -
|
$ (361,932.48)
|
$ (337,311.99)
|
$ (632,475.17)
|
$ 128,204.50
|
|||||
|
|
Net cash flows provided by (used in) financing activities
|
$ -
|
$ -
|
$ -
|
$ -
|
$ -
|
||||
|
Amount and Source Distributions
|
|
|
|
|
|
|||||
|
|
Total distributions paid to common stockholders
|
$ 330,000.00
|
$ 300,000.00
|
$ 363,000.00
|
$ 1,659,500.00
|
$ 296,000.00
|
||||
|
Distribution data per $1,000 invested:
|
|
|
|
|
|
|||||
|
|
Total distributions paid to common stockholders
|
330.00
|
300.00
|
363.00
|
1,659.50
|
296.00
|
||||
|
From operations and sales of properties
|
330.00
|
300.00
|
363.00
|
309.50
|
296.00
|
|||||
|
|
|
From all other sources (financing or offering proceeds)
|
-
|
-
|
-
|
1,350.00
|
-
|
|||
|
Summary Balance Sheet
|
|
|
|
|
|
|||||
|
|
Total assets (before depreciation)
|
$ 15,000,368.70
|
$ 15,064,167.95
|
$ 14,814,819.46
|
$ 14,439,541.72
|
$ 14,130,161.09
|
||||
|
Total assets (after depreciation)
|
$ 13,033,461.46
|
$ 13,172,353.95
|
$ 13,421,241.46
|
$ 13,532,042.72
|
$ 13,692,035.09
|
|||||
|
|
Total liabilities
|
$ 11,861,920.48
|
$ 11,962,404.48
|
$ 12,275,043.06
|
$ 12,240,220.94
|
$ 10,657,307.74
|
||||
|
Estimated per share value
|
N/A
|
N/A
|
N/A
|
N/A
|
N/A
|
|||||
Page | 122
|
River
|
||||||||||
|
Project 33
|
||||||||||
|
|
Period from Jan 31, 2011
|
|||||||||
|
|
(Date of Inception) to
|
|||||||||
|
Year Ended
|
Year Ended
|
Year Ended
|
Year Ended
|
Year Ended
|
||||||
|
Dec 31,2015
|
Dec 31,2014
|
Dec 31,2013
|
Dec 31,2012
|
Dec 31,2011
|
||||||
|
Summary Operating Results
|
|
|
||||||||
|
|
Gross revenues
|
$ 632,259.81
|
$ 1,821,275.55
|
$ 1,775,677.09
|
$ 1,691,350.36
|
$ 996,867.72
|
||||
|
Operating expenses
|
$ (359,219.88)
|
$ (1,013,227.51)
|
$ (996,687.02)
|
$ (1,066,668.75)
|
$ (868,934.34)
|
|||||
|
|
Opearing income (loss)
|
$ 273,039.93
|
$ 808,048.04
|
$ 778,990.07
|
$ 624,681.61
|
$ 127,933.38
|
||||
|
Interest expense
|
$ (95,947.42)
|
$ (295,356.44)
|
$ (300,480.93)
|
$ (415,858.84)
|
$ (484,602.75)
|
|||||
|
|
Net income (loss) - GAAP basis
|
$ 94,039.25
|
$ 209,552.05
|
$ 178,154.49
|
$ (140,257.31)
|
$ (740,479.70)
|
||||
|
Summary Statement of Cash Flows
|
|
|
|
|
|
|||||
|
|
Net cash flows provided by (used in) operating activities
|
$ 169,607.06
|
$ 300,802.22
|
$ 336,729.79
|
$ 444,880.76
|
$ 77,652.52
|
||||
|
Net cash flows provided by (used in) investing activities
|
$ (14,787.90)
|
$ 34,698.29
|
$ (224,281.82)
|
$ (76,679.00)
|
$ -
|
|||||
|
|
Net cash flows provided by (used in) financing activities
|
$ (130,000.00)
|
$ -
|
$ -
|
$ -
|
$ -
|
||||
|
Amount and Source Distributions
|
|
|
|
|
|
|||||
|
|
Total distributions paid to common stockholders
|
$ 130,000.00
|
$ 230,000.00
|
$ 75,000.00
|
$ 20,000.00
|
$ -
|
||||
|
Distribution data per $1,000 invested:
|
|
|
|
|
|
|||||
|
|
Total distributions paid to common stockholders
|
130.00
|
230.00
|
75.00
|
20.00
|
-
|
||||
|
From operations and sales of properties
|
130.00
|
230.00
|
75.00
|
20.00
|
-
|
|||||
|
|
|
From all other sources (financing or offering proceeds)
|
-
|
-
|
-
|
-
|
-
|
|||
|
Summary Balance Sheet
|
|
|
|
|
|
|||||
|
|
Total assets (before depreciation)
|
$ 8,276,411.49
|
$ 8,239,228.26
|
$ 8,351,303.68
|
$ 7,961,645.50
|
$ 7,021,249.12
|
||||
|
Total assets (after depreciation)
|
$ 7,140,614.13
|
$ 7,325,018.26
|
$ 7,491,575.98
|
$ 7,538,823.50
|
$ 7,021,249.12
|
|||||
|
|
Total liabilities
|
$ 6,791,885.72
|
$ 6,829,095.64
|
$ 6,975,205.39
|
$ 7,125,607.40
|
$ 5,101,728.82
|
||||
|
Estimated per share value
|
N/A
|
N/A
|
N/A
|
N/A
|
N/A
|
|||||
Page | 123
|
Table IV. Completed Projects
|
|||||
|
Projects that Have Completed Operations Within the Last Five Years
|
|||||
|
Page 1
|
|||||
|
Project 11
|
Project 12
|
Project 14
|
Project 15
|
||
|
Date Offering Closed
|
8/30/2013
|
6/21/2013
|
5/17/2013
|
9/11/2012
|
|
|
Amount Offered and Raised
|
4,539,748
|
9,612,208
|
4,314,601
|
2,183,000
|
|
|
Cost of Real Estate Purchased
|
10,700,000
|
26,100,000
|
12,600,000
|
4,420,000
|
|
|
Cost of Renovations
|
1,465,000
|
2,258,000
|
1,334,000
|
774,000
|
|
|
Date Property Was Sold
|
4/30/2015
|
4/30/2015
|
4/30/2015
|
4/30/2015
|
|
|
Net Proceeds of Sale
|
4,971,918
|
9,614,859
|
4,945,814
|
1,888,912
|
|
|
Distributions Per $10,000 Invested
|
44.20
|
58.00
|
80.30
|
27.20
|
|
|
Project IRR Over Life of Program
|
14.90%
|
12.36%
|
18.38%
|
24.75%
|
|
|
Annualized Return on Investment
|
10.76%
|
4.89%
|
10.49%
|
5.54%
|
|
|
Median Annual Leverage
|
65.68%
|
70.30%
|
74.20%
|
65.94%
|
|
Page | 124
|
Table IV. Completed Projects
|
|||||
|
Projects that Have Completed Operations Within the Last Five Years
|
|||||
|
Page 2
|
|||||
|
Project 16
|
Project 17
|
Project 18
|
Project 19
|
||
|
Date Offering Closed
|
8/6/2012
|
7/16/2012
|
6/28/2012
|
6/14/2012
|
|
|
Amount Offered and Raised
|
2,687,000
|
3,822,000
|
11,242,215
|
4,212,500
|
|
|
Cost of Real Estate Purchased
|
8,400,000
|
9,400,000
|
40,228,896
|
9,250,000
|
|
|
Cost of Renovations
|
900,000
|
1,600,000
|
3,516,000
|
1,220,000
|
|
|
Date Property Was Sold
|
9/24/2015
|
9/2/2015
|
4/30/2015
|
8/16/2015
|
|
|
Net Proceeds of Sale
|
4,468,946
|
3,303,781
|
12,348,323
|
5,074,828
|
|
|
Distributions Per $10,000 Invested
|
48.80
|
16.00
|
222.31
|
4.50
|
|
|
Project IRR Over Life of Program
|
29.22%
|
22.62%
|
14.41%
|
30.83%
|
|
|
Annualized Return on Investment
|
7.58%
|
1.40%
|
9.14%
|
0.36%
|
|
|
Median Annual Leverage
|
76.34%
|
70.00%
|
79.46%
|
78.80%
|
|
Page | 125
|
Table IV. Completed Projects
|
|||||
|
Projects that Have Completed Operations Within the Last Five Years
|
|||||
|
Page 3
|
|||||
|
Project 20
|
Project 21
|
Project 22
|
Project 23
|
||
|
Date Offering Closed
|
3/28/2012
|
3/23/2012
|
3/26/2012
|
12/15/2011
|
|
|
Amount Offered and Raised
|
2,852,500
|
5,090,000
|
4,680,000
|
6,275,013
|
|
|
Cost of Real Estate Purchased
|
8,800,000
|
4,000,000
|
13,650,000
|
13,000,000
|
|
|
Cost of Renovations
|
1,172,000
|
825,000
|
1,931,486
|
2,400,000
|
|
|
Date Property Was Sold
|
4/30/2015
|
10/8/2015
|
4/30/2015
|
4/30/2015
|
|
|
Net Proceeds of Sale
|
4,234,607
|
1,501,199
|
7,530,161
|
11,117,995
|
|
|
Distributions Per $10,000 Invested
|
194.30
|
18.80
|
51.00
|
126.60
|
|
|
Project IRR Over Life of Program
|
61.25%
|
11.63%
|
24.24%
|
25.71%
|
|
|
Annualized Return on Investment
|
21.48%
|
22.50%
|
4.65%
|
7.00%
|
|
|
Median Annual Leverage
|
80.22%
|
71.25%
|
77.01%
|
66.71%
|
|
Page | 126
|
Table IV. Completed Projects
|
|||||
|
Projects that Have Completed Operations Within the Last Five Years
|
|||||
|
Page 4
|
|||||
|
Project 24
|
Project 25
|
Project 26
|
Project 27
|
||
|
Date Offering Closed
|
10/18/2011
|
10/7/2011
|
9/29/2011
|
9/6/2011
|
|
|
Amount Offered and Raised
|
2,877,160
|
2,530,000
|
9,386,000
|
2,050,000
|
|
|
Cost of Real Estate Purchased
|
4,500,000
|
5,275,000
|
35,750,000
|
4,400,000
|
|
|
Cost of Renovations
|
900,000
|
1,388,000
|
900,000
|
880,000
|
|
|
Date Property Was Sold
|
6/16/2015
|
5/7/2015
|
4/30/2015
|
3/11/2016
|
|
|
Net Proceeds of Sale
|
4,542,601
|
2,619,592
|
10,034,681
|
1,767,650
|
|
|
Distributions Per $10,000 Invested
|
50.60
|
2.50
|
192.04
|
42.10
|
|
|
Project IRR Over Life of Program
|
19.91%
|
13.05%
|
11.59%
|
20.11%
|
|
|
Annualized Return on Investment
|
7.03%
|
1.98%
|
6.15%
|
6.09%
|
|
|
Median Annual Leverage
|
51.85%
|
70.54%
|
73.75%
|
71.02%
|
|
Page | 127
|
Table IV. Completed Projects
|
|||||
|
Projects that Have Completed Operations Within the Last Five Years
|
|||||
|
Page 5
|
|||||
|
Project 28
|
Project 29
|
Project 30
|
Project 31
|
||
|
Date Offering Closed
|
6/23/2011
|
5/20/2011
|
5/5/2011
|
1/12/2011
|
|
|
Amount Offered and Raised
|
8,399,342
|
3,950,000
|
5,500,000
|
6,590,060
|
|
|
Cost of Real Estate Purchased
|
33,400,000
|
11,700,000
|
4,600,000
|
14,200,000
|
|
|
Cost of Renovations
|
3,500,000
|
725,000
|
1,075,000
|
1,583,000
|
|
|
Date Property Was Sold
|
4/9/2014
|
4/30/2015
|
9/17/2015
|
4/30/2015
|
|
|
Net Proceeds of Sale
|
6,109,478
|
4,541,289
|
1,877,965
|
7,455,652
|
|
|
Distributions Per $10,000 Invested
|
100.18
|
80.30
|
58.90
|
258.24
|
|
|
Project IRR Over Life of Program
|
18.88%
|
12.72%
|
19.64%
|
37.90%
|
|
|
Annualized Return on Investment
|
3.98%
|
7.39%
|
24.47%
|
8.68%
|
|
|
Median Annual Leverage
|
59.03%
|
73.64%
|
80.45%
|
57.02%
|
|
Page | 128
|
Table IV. Completed Projects
|
|||||
|
Projects that Have Completed Operations Within the Last Five Years
|
|||||
|
Page 6
|
|||||
|
Project 32
|
Project 33
|
Project 34
|
Project 35
|
||
|
Date Offering Closed
|
1/5/2011
|
1/31/2011
|
9/22/2010
|
9/8/2010
|
|
|
Amount Offered and Raised
|
3,414,000
|
2,660,000
|
2,800
|
2,383,508
|
|
|
Cost of Real Estate Purchased
|
12,325,000
|
5,303,500
|
7,321,220
|
7,870,977
|
|
|
Cost of Renovations
|
750,000
|
1,713,930
|
2,444,450
|
944,248
|
|
|
Date Property Was Sold
|
4/30/2015
|
4/30/2015
|
6/19/2015
|
4/30/2015
|
|
|
Net Proceeds of Sale
|
6,417,154
|
2,887,867
|
7,446,182
|
5,523,783
|
|
|
Distributions Per $10,000 Invested
|
136.85
|
37.50
|
62.00
|
171.26
|
|
|
Project IRR Over Life of Program
|
34.82%
|
20.28%
|
25.59%
|
40.00%
|
|
|
Annualized Return on Investment
|
11.02%
|
7.60%
|
6.04%
|
18.47%
|
|
|
Median Annual Leverage
|
80.20%
|
68.40%
|
40.98%
|
73.69%
|
|
Page | 129
|
Table IV. Completed Projects
|
|||||
|
Projects that Have Completed Operations Within the Last Five Years
|
|||||
|
Page 7
|
|||||
|
Project 36
|
|||||
|
Date Offering Closed
|
5/7/2010
|
||||
|
Amount Offered and Raised
|
5,177,778
|
||||
|
Cost of Real Estate Purchased
|
15,770,580
|
||||
|
Cost of Renovations
|
1,938,150
|
||||
|
Date Property Was Sold
|
7/15/2015
|
||||
|
Net Proceeds of Sale
|
3,581,025
|
||||
|
Distributions Per $10,000 Invested
|
145.28
|
||||
|
Project IRR Over Life of Program
|
47.33%
|
||||
|
Annualized Return on Investment
|
6.24%
|
||||
|
Median Annual Leverage
|
50.73%
|
||||
Page | 130
|
Table V. Sales of Property Within Last Three Years
|
|||||
|
Page 1
|
|||||
|
Project 1
|
Project 2
|
Project 3
|
Project 4
|
||
|
Date Property Purchased
|
11/22/2016
|
10/29/2015
|
8/27/2015
|
1/14/2015
|
|
|
Date Property Sold
|
N/A
|
N/A
|
N/A
|
N/A
|
|
|
Cost of Property, With Improvements
|
14,181,840
|
11,600,000
|
36,331,031
|
5,102,008
|
|
|
Gross Selling Price of Property
|
N/A
|
N/A
|
N/A
|
N/A
|
|
|
Net Proceeds After Costs
|
N/A
|
N/A
|
N/A
|
N/A
|
|
|
Original Mortgage Financing
|
7,950,000
|
8,165,000
|
27,865,000
|
2,950,000
|
|
|
Mortgage Balance At Time of Sale
|
N/A
|
N/A
|
N/A
|
N/A
|
|
|
Mortgage Taken Back by Seller
|
N/A
|
N/A
|
N/A
|
N/A
|
|
Page | 131
|
Table V. Sales of Property Within Last Three Years
|
|||||
|
Page 2
|
|||||
|
Project 5
|
Project 6
|
Project 7
|
Project 8
|
||
|
Date Property Purchased
|
12/31/2014
|
11/25/2014
|
10/29/2014
|
10/14/2014
|
|
|
Date Property Sold
|
N/A
|
N/A
|
N/A
|
N/A
|
|
|
Cost of Property, With Improvements
|
6,645,000
|
14,088,000
|
31,925,000
|
14,092,000
|
|
|
Gross Selling Price of Property
|
N/A
|
N/A
|
N/A
|
N/A
|
|
|
Net Proceeds After Costs
|
N/A
|
N/A
|
N/A
|
N/A
|
|
|
Original Mortgage Financing
|
5,000,000
|
10,700,000
|
22,200,000
|
9,150,000
|
|
|
Mortgage Balance At Time of Sale
|
N/A
|
N/A
|
N/A
|
N/A
|
|
|
Mortgage Taken Back by Seller
|
N/A
|
N/A
|
N/A
|
N/A
|
|
Page | 132
|
Table V. Sales of Property Within Last Three Years
|
|||||
|
Page 3
|
|||||
|
Project 9
|
Project 10
|
Project 11
|
Project 12
|
||
|
Date Property Purchased
|
9/19/2014
|
12/23/2013
|
8/30/2013
|
6/21/2013
|
|
|
Date Property Sold
|
N/A
|
N/A
|
4/30/2015
|
4/30/2015
|
|
|
Cost of Property, With Improvements
|
211,402,695
|
19,450,000
|
12,165,000
|
28,358,000
|
|
|
Gross Selling Price of Property
|
N/A
|
N/A
|
13,370,000
|
31,180,000
|
|
|
Net Proceeds After Costs
|
N/A
|
0
|
N/A
|
N/A
|
|
|
Original Mortgage Financing
|
154,043,541
|
13,367,028
|
7,990,000
|
19,935,406
|
|
|
Mortgage Balance At Time of Sale
|
N/A
|
N/A
|
7,750,623
|
19,369,326
|
|
|
Mortgage Taken Back by Seller
|
N/A
|
N/A
|
N/A
|
N/A
|
|
Page | 133
|
Table V. Sales of Property Within Last Three Years
|
|||||
|
Page 4
|
|||||
|
Project 13
|
Project 14
|
Project 15
|
Project 16
|
||
|
Date Property Purchased
|
5/17/2013
|
10/31/2012
|
9/11/2012
|
8/6/2012
|
|
|
Date Property Sold
|
4/30/2015
|
5/6/2016
|
4/30/2015
|
9/24/2015
|
|
|
Cost of Property, With Improvements
|
13,934,000
|
53,905,000
|
5,194,000
|
9,300,000
|
|
|
Gross Selling Price of Property
|
15,920,000
|
82,851,750
|
7,194,000
|
12,100,000
|
|
|
Net Proceeds After Costs
|
N/A
|
16,761,736
|
N/A
|
4,468,946
|
|
|
Original Mortgage Financing
|
10,730,000
|
40,000,000
|
3,425,000
|
7,100,000
|
|
|
Mortgage Balance At Time of Sale
|
10,519,909
|
62,167,034
|
5,126,576
|
7,051,175
|
|
|
Mortgage Taken Back by Seller
|
N/A
|
N/A
|
N/A
|
N/A
|
|
Page | 134
|
Table V. Sales of Property Within Last Three Years
|
|||||
|
Page 5
|
|||||
|
Project 17
|
Project 18
|
Project 19
|
Project 20
|
||
|
Date Property Purchased
|
7/16/2012
|
6/28/2012
|
6/14/2012
|
3/28/2012
|
|
|
Date Property Sold
|
9/2/2015
|
4/30/2015
|
8/16/2015
|
4/30/2015
|
|
|
Cost of Property, With Improvements
|
11,000,000
|
43,744,896
|
10,470,000
|
9,972,000
|
|
|
Gross Selling Price of Property
|
15,200,000
|
48,910,000
|
18,100,000
|
14,910,000
|
|
|
Net Proceeds After Costs
|
3,303,781
|
N/A
|
5,074,828
|
N/A
|
|
|
Original Mortgage Financing
|
7,700,000
|
34,758,000
|
8,250,000
|
8,000,000
|
|
|
Mortgage Balance At Time of Sale
|
7,700,000
|
34,460,043
|
7,924,931
|
10,377,193
|
|
|
Mortgage Taken Back by Seller
|
N/A
|
N/A
|
N/A
|
N/A
|
|
Page | 135
|
Table V. Sales of Property Within Last Three Years
|
|||||
|
Page 6
|
|||||
|
Project 21
|
Project 22
|
Project 23
|
Project 24
|
||
|
Date Property Purchased
|
3/23/2012
|
3/26/2012
|
12/15/2011
|
10/18/2011
|
|
|
Date Property Sold
|
10/8/2015
|
4/30/2015
|
4/30/2015
|
6/16/2015
|
|
|
Cost of Property, With Improvements
|
4,825,000
|
15,581,486
|
15,400,000
|
5,400,000
|
|
|
Gross Selling Price of Property
|
7,300,000
|
20,490,000
|
22,310,000
|
7,760,000
|
|
|
Net Proceeds After Costs
|
1,501,199
|
N/A
|
N/A
|
4,542,601
|
|
|
Original Mortgage Financing
|
0
|
12,000,000
|
10,274,000
|
2,900,000
|
|
|
Mortgage Balance At Time of Sale
|
3,437,800
|
11,552,776
|
9,978,515
|
2,800,000
|
|
|
Mortgage Taken Back by Seller
|
N/A
|
N/A
|
N/A
|
N/A
|
|
Page | 136
|
Table V. Sales of Property Within Last Three Years
|
|||||
|
Page 7
|
|||||
|
Project 25
|
Project 26
|
Project 27
|
Project 28
|
||
|
Date Property Purchased
|
10/7/2011
|
9/29/2011
|
9/6/2011
|
6/23/2011
|
|
|
Date Property Sold
|
5/7/2015
|
4/30/2015
|
3/11/2016
|
4/9/2014
|
|
|
Cost of Property, With Improvements
|
6,663,000
|
35,750,000
|
5,280,000
|
20,499,342
|
|
|
Gross Selling Price of Property
|
9,250,000
|
38,090,000
|
6,700,000
|
28,450,000
|
|
|
Net Proceeds After Costs
|
2,619,592
|
N/A
|
1,767,650
|
6,109,478
|
|
|
Original Mortgage Financing
|
4,700,000
|
26,364,000
|
3,750,000
|
12,100,000
|
|
|
Mortgage Balance At Time of Sale
|
6,000,000
|
25,908,807
|
4,908,061
|
14,034,334
|
|
|
Mortgage Taken Back by Seller
|
N/A
|
N/A
|
N/A
|
N/A
|
|
Page | 137
|
Table V. Sales of Property Within Last Three Years
|
|||||
|
Page 8
|
|||||
|
Project 29
|
Project 30
|
Project 31
|
Project 32
|
||
|
Date Property Purchased
|
5/20/2011
|
5/5/2011
|
1/12/2011
|
1/5/2011
|
|
|
Date Property Sold
|
4/30/2015
|
9/17/2015
|
4/30/2015
|
4/30/2015
|
|
|
Cost of Property, With Improvements
|
12,425,000
|
5,675,000
|
15,783,000
|
13,075,000
|
|
|
Gross Selling Price of Property
|
14,270,000
|
7,400,000
|
24,260,000
|
18,520,000
|
|
|
Net Proceeds After Costs
|
N/A
|
1,877,965
|
N/A
|
N/A
|
|
|
Original Mortgage Financing
|
9,150,000
|
0
|
9,000,000
|
10,486,000
|
|
|
Mortgage Balance At Time of Sale
|
8,748,093
|
4,565,410
|
16,319,149
|
11,732,446
|
|
|
Mortgage Taken Back by Seller
|
N/A
|
N/A
|
N/A
|
N/A
|
|
Page | 138
|
Table V. Sales of Property Within Last Three Years
|
|||||
|
Page 9
|
|||||
|
Project 33
|
Project 34
|
Project 35
|
Project 36
|
||
|
Date Property Purchased
|
1/31/2011
|
9/22/2010
|
9/8/2010
|
5/7/2010
|
|
|
Date Property Sold
|
4/30/2015
|
6/19/2015
|
4/30/2015
|
7/15/2015
|
|
|
Cost of Property, With Improvements
|
7,017,430
|
7,321,220
|
7,870,977
|
15,770,580
|
|
|
Gross Selling Price of Property
|
9,870,000
|
12,150,000
|
12,290,000
|
20,238,000
|
|
|
Net Proceeds After Costs
|
N/A
|
7,446,182
|
N/A
|
N/A
|
|
|
Original Mortgage Financing
|
4,800,000
|
3,000,000
|
5,800,000
|
8,000,000
|
|
|
Mortgage Balance At Time of Sale
|
6,657,389
|
5,293,818
|
6,520,417
|
13,273,765
|
|
|
Mortgage Taken Back by Seller
|
N/A
|
N/A
|
N/A
|
N/A
|
|
NOTE: A total of 33 properties were acquired, in ten project offerings. Thus, Project 10b refers to one of two properties acquired in the tenth project. Because the purchase price and financing for some projects were negotiated on an aggregate basis, rather than on a property-specific basis, the Leverage calculations are more meaningful in the aggregate.
Page | 139
GLOSSARY OF DEFINED TERMS
|
ADA
|
Americans with Disabilities Act of 1990.
|
|
Authorizing
Resolution
|
The resolution adopted by the Manager on September 1, 2016 creating and setting forth the terms of the Series A Investor Shares.
|
|
Code
|
Internal Revenue Code of 1986, as amended.
|
|
Folio
|
Folio Investments, Inc., a registered broker-dealer and member FINRA/SIPC.
|
|
Fund
|
Impact Workforce Housing REIT, LLC, a Delaware limited liability company.
|
|
Investor
|
Anyone who purchases Series A Investor Shares in this Offering.
|
|
Joint Venture
|
One or more joint venture real estate investment arrangements between the Fund and third-party financial partners selected by the Manager from time to time.
|
|
LLC Agreement
|
The Limited Liability Company Agreement of the Company dated September 1, 2016.
|
|
Manager
|
Workforce Housing REIT Manager, LLC, a Delaware limited liability company.
|
|
Offering
|
The offer and sale of the Fund’s Series A Investor Shares described in this Offering Circular.
|
|
Preferred Return
|
The cumulative, non-compounded annual return of 7.0%, described in the “Securities Being Offered – Distributions” section beginning on page 46.
|
|
Promoted Interest
|
The distributions to which the Manager is entitled, described in the “Securities Being Offered – Distributions” section beginning on page 46.
|
|
Regulations
|
Regulations issued by the Internal Revenue Service.
|
|
REIT
|
Real estate investment trust, as defined in section 856 of the Code.
|
|
SEC
|
Securities and Exchange Commission.
|
|
Securities Act
|
The Securities Act of 1933, as amended.
|
|
Series A Investor
Shares |
The limited liability company interests of the Fund being offered in this Offering.
|
|
Sponsor
|
Strategic Realty Holdings, LLC, a Delaware limited liability company.
|
|
SRC
|
Strategic Realty Capital, LLC.
|
|
SRH
|
Strategic Realty Holdings, LLC.
|
Page | 140
FORM 1-A
Regulation A Offering Statement
Part II – Offering Circular
Impact Housing REIT, LLC
23901 Calabasas Road Suite 2010
Calabasas, CA 93102
9818) 737-8000
www.ImpactHousing.com
June 7, 2018
The following Exhibits are filed as part of this Offering Statement:
|
Exhibit 1A-1A
|
Securities Distribution Agreement between the Fund and Folio dated December 11, 2017*
|
|
Exhibit 1A-1B
|
Escrow Services and Custody Agreement between the Fund and Folio dated December 11, 2017*
|
|
Exhibit 1A-2A
|
Certificate of Formation.*
|
|
Exhibit 1A-2B
|
LLC Agreement – The agreement by and among the Fund and all of its members captioned “Limited Liability Company Agreement” and dated September 1, 2016.*
|
|
Exhibit 1A-6A
|
Management Agreement – The agreement captioned “Management Services Agreement” between the Fund and the Manager dated September 1, 2016.*
|
|
Exhibit 1A-6E
|
Investment Agreement.*
|
|
Exhibit 1A-8
|
Escrow Agreement dated June 13, 2017.*
|
|
Exhibit 1A-11
|
Consent of Independent Auditor.*
|
|
Exhibit 1A-12
|
Legal opinion of Flaster/Greenberg P.C.*
|
|
Exhibit 1A-15.1
|
[Reserved]
|
|
Exhibit 1A-15.2
|
Authorizing Resolution – The resolution adopted by the Manager creating and setting forth the terms of the Series A Investor Shares.*
|
|
Exhibit 1A-15A
|
Draft Offering Statement dated September 27, 2016 submitted pursuant to Rule 252(d) (incorporated by reference to the copy thereof previously made public pursuant to Rule 301 of Regulation S-T).*
|
|
Exhibit 1A-15B
|
Correspondence to the SEC on behalf of the Fund dated December 1, 2016, previously submitted pursuant to Rule 252(d).*
|
|
Exhibit 1A-15C
|
Investor presentation materials.
|
|
Exhibit 1A-15D
|
Investor presentation materials.
|
|
Exhibit 1A-15E
|
Examples of our Sponsor’s Prior Environmental Impact & Savings CapEx Programs.*
|
* Incorporated by reference to the copy previously filed and made public.
Page | 141
SIGNATURES
Pursuant to the requirements of Regulation A, the issuer certifies that it has reasonable grounds to believe that it meets all of the requirements for filing on Form 1-A and has duly caused this offering statement to be signed on its behalf by the undersigned, thereunto duly authorized, in the City of Calabasas, State of California, on June 7, 2018.
|
IMPACT HOUSING REIT, LLC
|
|||
|
By
|
/s/ Edward P. Lorin
|
||
|
Edward P. Lorin, Manager
Impact Housing REIT Manager, LLC, Manager
|
|||
This offering statement has been signed by the following persons in the capacities and on the dates indicated.
|
/s/ Edward P. Lorin
|
|
|
Edward P. Lorin, Manager
|
|
|
Impact Housing REIT Manager, LLC, Manager
|
|
|
June 7, 2018
|
Page | 142